Digitizing Vector Maps
There are two ways of vectorizing maps (AKA digitizing):
using a digitizer,
digitizing on-screen.
In the first case the map is placed on the digitizer, the corners are selected by a mouse click and the respective coordinates entered through the keyboard. This process is called "'registering a map"'. The advantage of this method is that the user is always in control of the whole map. However, the high price of the equipment and the lack of magnification capabilities, e.g. for low-quality maps, are significant disadvantages. Furthermore, the map must not show any signs of lateral stretch to prevent wrong site coordinates.
On-screen digitizing requires a scanned and geocoded raster map (image) that is displayed on a GRASS monitor. All relevant map objects will be vectorized using the mouse. It is not necessary to register such a map as it is geocoded already. The advantage of this method is the support of zooming, hence an improved accuracy can be achieved. Apart from access to a scanner no financial input is required. However, the disadvantage of this method lies in the somewhat awkward orientation on the map on the screen.
Rules for Digitizing in Topological GIS
There are a few basic rules regarding digitizing from analogue maps that apply to topological GIS, such as GRASS. Obedience to these rules is essential in order to use the topological features of the software.
Lines must not cross without nodes.
Lines that use common "node" must hit it exactly. Make use of the snapping function of the digitizing module.
Common area boundaries must only be digitized once.
Areas must be closed. Use the snapping function of the digitizing module.
Store lines and areas in separate maps to avoid problems with crossing lines. It is also easier to assign a certain type (line or area boundary) to a line.
Digitizing Maps
If there is no digitizer available but a scanner, it is still easy to digitize a map. You can find information on importing a scanned map into GRASS in the chapter called Raster Import and the chapter called Processing Scanned Maps.
You can use your mouse for digitizing instead of a digitizer. After starting a GRASS monitor, run the module v.digit (in tcltkgrass chose 'Vector->Develop map->Digitize')to change the settings from digitizer to mouse. Choose digitizer "'none"'. After selecting a new or existing vector file you will see a dialogue requesting project data. It is necessary to change the parameter "'Map's scale"' from 1:0 to the respective scale of the map:
Provide the following information:

        Your organization    Geographisches Institut_____
        Todays date (mon,yr) Jan 25 99__________
        Your name            Emil______________
        Maps name           realnutzung____________________________
        Maps date           __________
        Maps scale          1:25000____
        Other info           Sommer 1998____________________________
        Zone                 0____
        West edge of area    3568750_______
        South edge of area   5762774_______
        East edge of area    3574250_______
        North edge of area   5767726_______
|
In order to digitize on the basis of the scanned raster map, place it in the background: Choose "Backdrop cell map" ('B') from the "Customize" menu ('C'). This will load the raster map to the background.
Now you can open the digitizing menu by pressing 'D'. The module v.digit is somewhat self-explanatory, for more specific information please refer to the CERL v.digit tutorial (pdf file). The 'Color' menu under 'Customize' allows you to change the colors of the digitized objects (lines, areas). This allows for optimized color coding. It is important to choose the appropriate type of object (area, line, site) by pressing 't'. If necessary, switch on the 'auto labelling function'. This function assigns the category number, however, it is not (yet) possible to enter the category text in v.digit. Because of this you should write down which category number belongs to which object. Run the module v.support to enter the category labels ('Edit the category file'- in tcltkgrass chose 'Vector->Develop map->Edit vector categories').
Make use of the 'zoom function to improve your accuracy significantly.
To avoid confusion: Points may be saved as vectors or in GRASS sites format. Vectors are usually the result of digitizing, points in the GRASS format result from files with coordinates (N,E) and attributes.
Again, it is an important rule to digitize boundaries of adjacent areas only once. GRASS automatically assigns this boundary to both areas. Never digitize two parallel lines!
Digitizing Areas
Digitizing areas is generally a bit harder and requires more practice. For this reason we will explain setting of attributes in more detail. Choose the vector types in the 'Digitize' menu of the v.digit module.
Press 't' to toggle the type between:
LINE,
AREA EDGE,
SITE.
It is mandatory to close areas because only then you can create the GIS vector topology and assign label points. Since it is nearly impossible to hit line ends exactly, the snapping function allows the closing of areas:
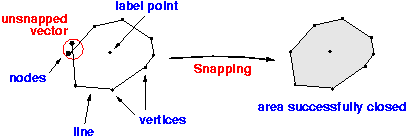
Under 'Customize', in the main menu of v.digit, you can adjust the snapping threshold, 's' - Set snapping threshold. After setting it to a reasonable value the nodes will automatically snap to close the area. Only after connecting all nodes your area will be recognized as such. The snapping threshold should be chosen appropriately for the scale of the map. You have to enter the value in inches, but it will be automatically converted to the metric units of the map.
Here are some examples:
For 1:5.000 - 1:10.000: Snap distance 1-2m (Value in Inches in the menu: 0.0017 to 0.002)
For 1:10.000 - 1:25.000: Snap distance 2-5m (Value in Inches in the menu: 0.002 to 0.008)
For 1:25.000 - 1:50.000: Snap distance 5-10m (Value in Inches in the menu: 0.008 to 0.017)
Note: GRASS will not display a useful value in the menu if you did not enter the correct scale at the very beginning. In this case exit v.digit and restart it with the same map. Now set the correct scale in the first dialogue.
Here are some of the more common problems with digitization:
Lines may not connect properly when either the snapping threshold was set inappropriately or the zoom factor was too small. Too short lines are called 'undershoot', too long ones 'overshoot'.
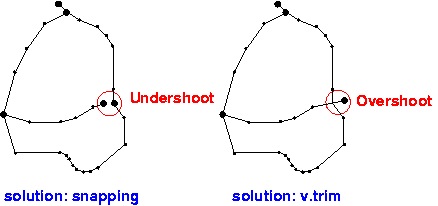
Use the snapping function to link the vectors in the case of undershoot. 'Snapping' is a function of v.digit and v.support (enter the snapping threshold in accordance to the map scale). Run the GRASS module v.rm.dangles to trim 'overshoots'.
Note: Some people use 'overshoots' deliberately to make sure areas are closed. However, it is necessary to trim these lines afterwards. It is common use to create a square - 'neatline' - around the project area. With this method you can vectorize your map and 'overshoot deliberately as GRASS can trim automatically to the boundaries of the square at a later stage. The square is considered part of the area boundary.
As a general rule, always run v.support (in tcltkgrass: 'Vector->Develop map->Create/rebuild topology') after v.digit to (re-)create the topology of the vector data. At this point you may also want to enter the appropriate category texts ('Edit the category file'). If you have got a lot of category numbers there is the option to enter line numbers in the bottom line of the window, press 'ESC 'RETURN to get there.
Post-digitizing work:
Often it proves to be quite difficult to match up the end points of lines when vectorizing areas. (An area is a closed polygon, which means both ends of the line have to be connected). The v.spag module can help if you encounter such problems.
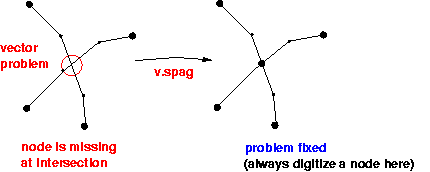
Another very useful feature of v.spag is inserting missing nodes at line intersections. However, use this command with care! Create a backup copy of your map with g.copy to be on the safe side. You cannot undo changes made with v.spag!
Other very helpful modules are v.clean and v.prune. Use v.clean to remove 'dead' lines from your map. 'Dead' lines are vectors that have been marked as deleted in v.digit. The module v.prune can be used to remove obsolete nodes. Use it with care as you can simplify complex areas/polygons to squares or triangles if you remove too many nodes.
Digitizing of Elevation Isolines
Digitizing isolines works just like with ordinary vector lines. GRASS offers an easy way to attach the elevation data to these lines:
First digitize the lines without attributes. Then change to the 'Label' menu by pressing 'L'. Now hit 'i' for 'contour interval' and select the appropriate interval of lines, default is 5 base units per line. The base unit is usually meter, hence it defaults to 5 m. After that press 'c' for 'Label contours' and start entering your elevation data. Generally, if you assign elevation attributes to the outer and inner isolines, all the lines in between will be assigned automatically depending on the given interval. To get this to work you need to draw a line between the first and the second point of your choice. All the isolines that this line crosses receive an attribute containing their elevation. GRASS automatically checks if the number of lines matches the chosen interval. Take care not to get too close to isolines you don't want to label, as the temporary line allows some tolerance in placement. If necessary change the thresholds in the 'Customize' menu (press 'C').
Select an outer line with the left mouse button, e.g. in a 'valley, and confirm your selection with the middle mouse button. Now enter the elevation of this line. Then point the mouse to the other side of the lot of lines, e.g. on a 'hill, and again select with the left mouse button, confirm with the middle one and enter its elevation. Now these two lines are connected by a straight line that crosses all the isolines in between. All these lines automatically get assigned the appropriate value. In the case the chosen interval and the number of lines do not match GRASS will display an error (warning) message and stop the process. If this happens please count again or choose smaller steps.