NAME
r.univar - Calculates univariate statistics from the non-null cells of a raster map.Statistics include number of cells counted, minimum and maximum cell values, range, arithmetic mean, population variance, standard deviation, coefficient of variation, and sum.
KEYWORDS
raster, statistics, univariate statistics, zonal statisticsSYNOPSIS
Flags:
- -g
- Print the stats in shell script style
- -e
- Calculate extended statistics
- -t
- Table output format instead of standard output format
- -r
- Use the native resolution and extent of the raster map, instead of the current region
- --overwrite
- Allow output files to overwrite existing files
- --help
- Print usage summary
- --verbose
- Verbose module output
- --quiet
- Quiet module output
- --ui
- Force launching GUI dialog
Parameters:
- map=name[,name,...] [required]
- Name of raster map(s)
- zones=name
- Raster map used for zoning, must be of type CELL
- output=name
- Name for output file (if omitted or "-" output to stdout)
- percentile=float[,float,...]
- Percentile to calculate (requires extended statistics flag)
- Options: 0-100
- Default: 90
- separator=character
- Field separator
- Special characters: pipe, comma, space, tab, newline
- Default: pipe
Table of contents
DESCRIPTION
r.univar calculates the univariate statistics of one or several raster map(s). This includes the number of cells counted, minimum and maximum cell values, range, arithmetic mean, population variance, standard deviation, coefficient of variation, and sum. Statistics are calculated separately for every category/zone found in the zones input map if given. If the -e extended statistics flag is given the 1st quartile, median, 3rd quartile, and given percentile are calculated. If the -g flag is given the results are presented in a format suitable for use in a shell script. If the -t flag is given the results are presented in tabular format with the given field separator. The table can immediately be converted to a vector attribute table which can then be linked to a vector, e.g. the vector that was rasterized to create the zones input raster.When multiple input maps are given to r.univar, the overall statistics are calculated. This is useful for a time series of the same variable, as well as for the case of a segmented/tiled dataset. Allowing multiple raster maps to be specified saves the user from using a temporary raster map for the result of r.series or r.patch.
NOTES
As with most GRASS raster modules, r.univar operates on the raster array defined by the current region settings, not the original extent and resolution of the input map. See g.region, but also the wiki page on the computational region to understand the impact of the region settings on the calculations.This module can use large amounts of system memory when the -e extended statistics flag is used with a very large region setting. If the region is too large the module should exit gracefully with a memory allocation error. Basic statistics can be calculated using any size input region. Extended statistics can be calculated using r.stats.quantile.
Without a zones input raster, the r.quantile module will be significantly more efficient for calculating percentiles with large maps.
For calculating univariate statistics from a raster map based on vector polygon map and uploads statistics to new attribute columns, see v.rast.stats.
EXAMPLES
Univariate statistics
In this example, the raster map elevation in the North Carolina sample dataset is used to calculate univariate statistics:g.region raster=elevation -p # standard output, along with extended statistics r.univar -e elevation percentile=98 total null and non-null cells: 2025000 total null cells: 0 Of the non-null cells: ---------------------- n: 2025000 minimum: 55.5788 maximum: 156.33 range: 100.751 mean: 110.375 mean of absolute values: 110.375 standard deviation: 20.3153 variance: 412.712 variation coefficient: 18.4057 % sum: 223510266.558102 1st quartile: 94.79 median (even number of cells): 108.88 3rd quartile: 126.792 98th percentile: 147.727 # script style output, along with extended statistics r.univar -ge elevation percentile=98 n=2025000 null_cells=0 cells=2025000 min=55.5787925720215 max=156.329864501953 range=100.751071929932 mean=110.375440275606 mean_of_abs=110.375440275606 stddev=20.3153233205981 variance=412.712361620436 coeff_var=18.4056555243368 sum=223510266.558102 first_quartile=94.79 median=108.88 third_quartile=126.792 percentile_98=147.727
Zonal statistics
In this example, the raster polygon map basins in the North Carolina sample dataset is used to calculate raster statistics for zones for elevation raster map:g.region raster=basins -p
projection: 99 (Lambert Conformal Conic)
zone:       0
datum:      nad83
ellipsoid:  a=6378137 es=0.006694380022900787
north:      228500
south:      215000
west:       630000
east:       645000
nsres:      10
ewres:      10
rows:       1350
cols:       1500
cells:      2025000
r.category basins
2
4
6
8
10
12
14
16
18
20
22
24
26
28
30
d.mon wx0
d.rast map=elevation
r.colors map=elevation color=grey
d.rast map=basins
r.colors map=basins color=bgyr
d.legend raster=basins use=2,4,6,8,10,12,14,16,18,20,22,24,26,28,30
d.barscale
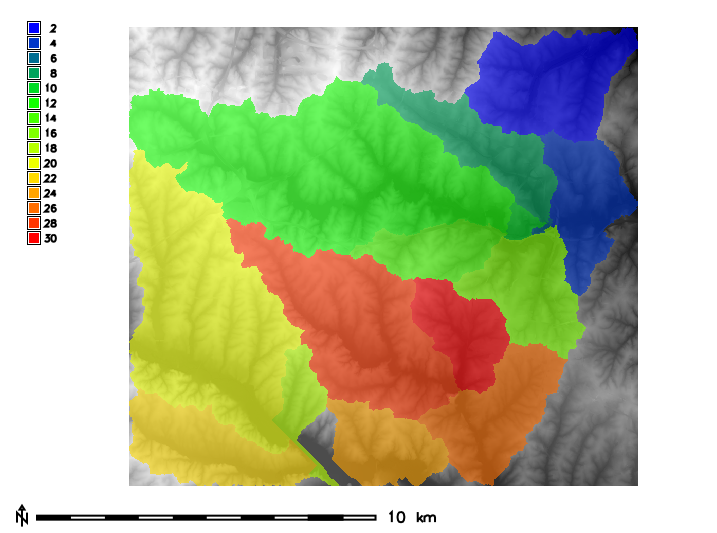
Figure: Zones (basins, opacity: 60%) with underlying elevation map for North Carolina sample dataset.
Then statistics for elevation can be calculated separately for every zone, i.e. basin found in the zones parameter:
r.univar -t map=elevation zones=basins separator=comma \
         output=basin_elev_zonal.csv
zone,label,non_null_cells,null_cells,min,max,range,mean,mean_of_abs,
stddev,variance,coeff_var,sum,sum_abs2,,116975,0,55.5787925720215,
133.147018432617,77.5682258605957,92.1196971445722,92.1196971445722,
15.1475301152556,229.447668592576,16.4433129773355,10775701.5734863,
10775701.57348634,,75480,0,61.7890930175781,110.348838806152,
48.5597457885742,83.7808205765268,83.7808205765268,11.6451777476995,
135.610164775515,13.8995747088232,6323776.33711624,6323776.33711624
6,,1137,0,66.9641571044922,83.2070922851562,16.2429351806641,
73.1900814395257,73.1900814395257,4.15733292896409,17.2834170822492,
5.68018623179036,83217.1225967407,83217.12259674078,,80506,
0,67.4670791625977,147.161514282227, ...
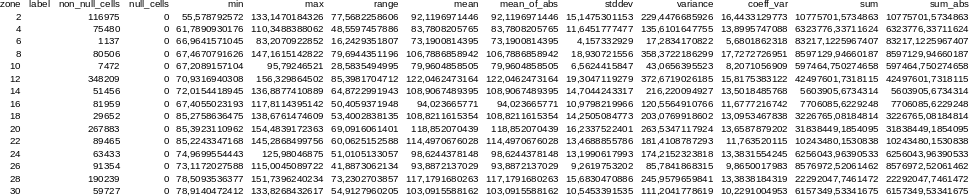
Figure: Raster statistics for zones (basins, North Carolina sample dataset) viewed through Libre/Open Office Calc.
TODO
To be implemented mode, skewness, kurtosis.SEE ALSO
g.region, r3.univar, r.mode, r.quantile, r.series, r.stats, r.stats.quantile, r.stats.zonal, r.statistics, v.rast.stats, v.univarAUTHORS
Hamish Bowman, Otago University, New ZealandExtended statistics by Martin Landa
Multiple input map support by Ivan Shmakov
Zonal loop by Markus Metz
SOURCE CODE
Available at: r.univar source code (history)
Latest change: Thu Feb 3 11:10:06 2022 in commit: 73413160a81ed43e7a5ca0dc16f0b56e450e9fef
Main index | Raster index | Topics index | Keywords index | Graphical index | Full index
© 2003-2022 GRASS Development Team, GRASS GIS 8.0.3dev Reference Manual