wxGUI Interactive Scatter Plot Tool
DESCRIPTION
Interactive Scatter Plot Tool allows analyzing group of raster maps.
The tool is integrated into Supervised Classification
Tool (see the screen shot below). Also it is possible
to launch it from Map Display Window
(Analyze map → Interactive Scatter Plot Tool). The main idea of the
tool is that everything is linked together (scatter plots together and
mapwindow with the scatter plots). The main feature of the tool is the
interactivity, which allows user to:
- work with multiple plots, which represents multiple raster bands combinations,
- highlight plotted points in open scatter plots according to currently chosen pixels for classes by it's training areas (supported only in Supervised Classification Tool),
- be able to define areas in plots and the tool will highlight pixels in map display window and corresponding points in other plots,
- plot of confidence ellipses.
TOOL CONTROLS LAYOUT
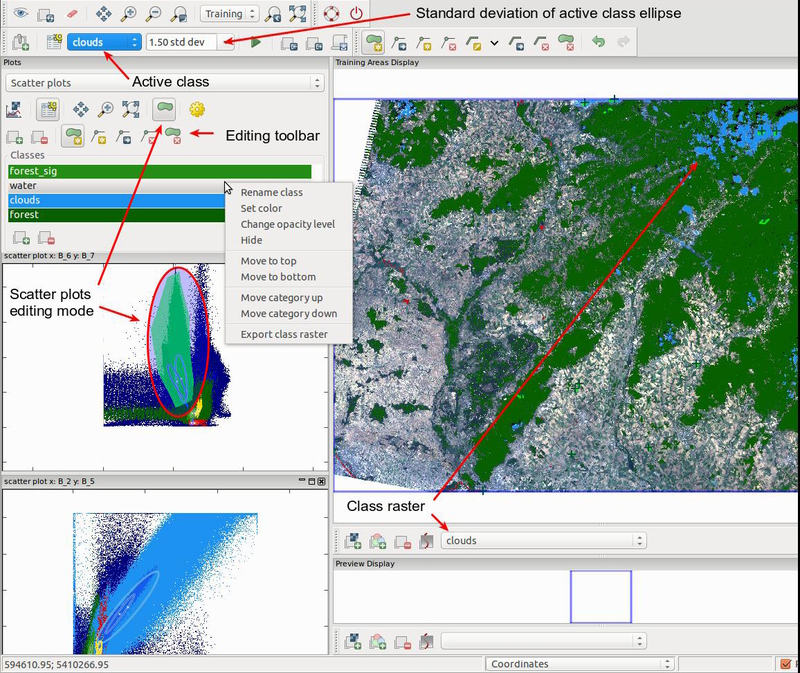
If editing mode is activated (the green polygon tool in toolbar), the
areas which were selected in the scatter plots are highlighted. In the
image you can see this area for scatter plot of bands B_6, B_7 inside
the ellipse. Opacity and color of the selected area can be set in
settings. The area corresponds to the active class (in this case
clouds). Selected areas are subset of areas, which belongs to the
category.
In the editing mode it is possible to select certain area by the polygon, which can be created and edited by tools in editing toolbar. After the area is selected, we can include or exclude it into active category by clicking on the first (plus) respectively second (minus) tool in the editing toolbar. In mapwindow corresponding pixels are shown by the class raster representing selected areas in scatter plots. In this case we can see clouds class raster (blue), forest class raster (green) and water class raster (red).
NOTES
The tool can analyze only integer (CELL) rasters. It works with 8 bit range smoothly. The tool is capable of processing data up to 12 bit range, however it is not recommended open many scatter plots in 12/11 bit mode. It could require significant amount of memory and plot rendering time can be longer. Analyzing of raster data with higher range is not recommended. The raster range can be lowered using r.rescale.
KNOWN ISSUES
Selection of areas in mapwindow is currently supported only if the tool was launched from Supervised Classification Tool.
SEE ALSO
wxGUI, wxGUI components, r.rescale
See also the user wiki page.
AUTHOR
Stepan Turek, Google Summer of Code 2013 (mentor: Martin Landa)
SOURCE CODE
Available at: wxGUI.iscatt source code
(history)
Latest change: Thursday Feb 12 09:11:33 2026 in commit a73312d