Note: This document is for an older version of GRASS GIS that is outdated. You should upgrade, and read the current manual page.

NAME
d.vect.chart - Displays charts of vector data in the active frame on the graphics monitor.
KEYWORDS
display, cartography
SYNOPSIS
d.vect.chart
d.vect.chart help
d.vect.chart [-cl] map=name [type=string[,string,...]] [layer=integer] [ctype=string] columns=string[,string,...] [sizecol=string] [size=integer] [scale=float] [ocolor=string] [colors=string[,string,...]] [max_ref=float[,float,...]] [--verbose] [--quiet]
Flags:
- -c
- Center the bar chart around a data point
- -l
- Create legend information and send to stdout
- --verbose
- Verbose module output
- --quiet
- Quiet module output
Parameters:
- map=name
- Name of input vector map
- type=string[,string,...]
- Feature type
- Options: point,line,boundary,centroid,area
- Default: point,line,boundary,centroid
- layer=integer
- Layer number
- A single vector map can be connected to multiple database tables. This number determines which table to use.
- Default: 1
- ctype=string
- Chart type
- Options: pie,bar
- Default: pie
- columns=string[,string,...]
- Attribute columns containing data
- sizecol=string
- Column used for pie chart size
- size=integer
- Size of chart (diameter for pie, total width for bar)
- Default: 40
- scale=float
- Scale for size (to get size in pixels)
- Default: 1
- ocolor=string
- Outline color
- Default: black
- colors=string[,string,...]
- Colors used to fill charts
- max_ref=float[,float,...]
- Maximum value used for bar plot reference
DESCRIPTION
d.vect.chart displays charts for GRASS vector data in the active frame on the graphics
monitor.
NOTES
The charts are positioned as follows:
- vector points: on point position
- vector lines: on line centers
- vector areas: on area centroids
Bar charts are placed with their lower edge starting from the y-coordinate of the feature being symbolized, and centered with respect to the x-coordinate. The -c flag can be used to center the bar chart in both x and y directions.
The 'sizecol' parameter is proportionate to the radius.
The optional max_ref parameter accepts a list of values that represent the maximum value for each column listed in the values for the parameter columns. These values are used to create a framed bar plot if ctype is bar (See Example 2).
EXAMPLES
Example 1
d.vect.chart map=vectmap columns=cens51,cens61,cens71,cens81
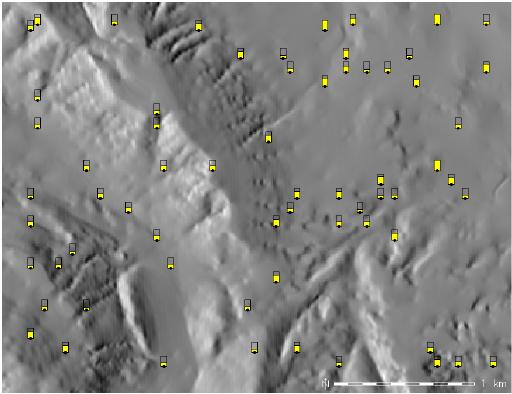
Example 2
Create framed bar graphs of an erodibiliy index from the SPEARFISH dataset.
r.to.vect -s -v in=erode.index out=erode_index feature=area
v.extract in=erode_index out=erode_index_ctrds type=centroid
d.rast aspect
d.vect.chart map=erode_index_ctrds ctype=bar columns=cat \
             size=10 max_ref=12 scale=1.5 colors=yellow
d.vect erode_index_ctrds icon=basic/circle fcol=black col=black size=5
SEE ALSO
d.erase,
d.vect,
d.vect.thematic,
d.what.vect,
d.rast
AUTHOR
Radim Blazek, ITC-Irst, Trento, Italy
Last changed: $Date: 2011-11-08 02:23:26 -0800 (Tue, 08 Nov 2011) $
Main index - display index - Full index
© 2003-2014 GRASS Development Team