Note: This document is for an older version of GRASS GIS that has been discontinued. You should upgrade, and read the current manual page.
NAME
g.gui.animation - Tool for animating a series of raster and vector maps or a space time raster or vector dataset.KEYWORDS
general, GUI, display, animationSYNOPSIS
Flags:
- --help
- Print usage summary
- --verbose
- Verbose module output
- --quiet
- Quiet module output
- --ui
- Force launching GUI dialog
Parameters:
- raster=name[,name,...]
- Raster maps to animate
- vector=name[,name,...]
- Vector maps to animate
- Or data source(s) for direct OGR access
- strds=name
- Space time raster dataset to animate
- stvds=name
- Space time vector dataset to animate
Table of contents
DESCRIPTION
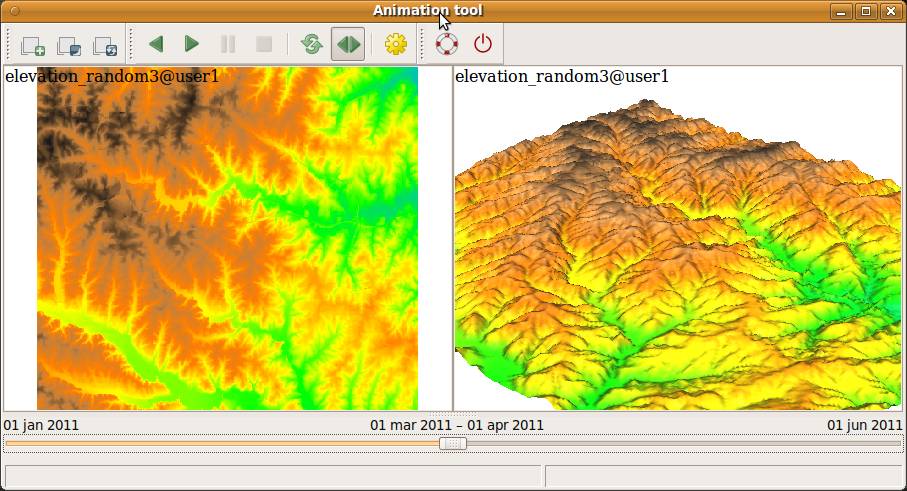
The Animation Tool is a wxGUI component for animating series of GRASS raster or vector maps or space time datasets (created by t.* modules).Animation Tool allows you to:
- display up to 4 synchronized animations
- each animation can consist of base map layer(s) and (multiple) series in arbitrary order (for example, raising water level with elevation)
- control the animation speed
- interactively change active frame using a slider
- visualize space time datasets with unequally spaced intervals
- animate 3d view (partially implemented, not supported on Windows)
- export animation as a series of images, animated GIF, AVI or SWF
- choose format of time labels in case of animating maps with absolute time
- choose background color
- set starting and ending region in order to change region during animation (alternatively you can set N-S/E-W values instead of the ending region; these are used for making the region smaller or larger for each step)
3D view animation enables to animate raster (as an elevation map or a color map) or vector map (points, lines). Internally, module m.nviz.image is used. To display 3D view animation follow these steps:
- open GRASS GUI, load maps and start 3D view
- set view, light and other parameters as you like
- save workspace file
- add new animation in Animation Tool, choose 3D view mode
- choose data (series of maps or space time dataset) used for animation
- set workspace file
- choose parameter (parameter of m.nviz.image) to animate (e.g. color_map)
NOTE
The Animation Tool follows the computational region settings, so please be sure your computational region is set to the geographic extent of maps you are animating. You can change the computational region (using g.region) and then reload the maps to update the animation.EXAMPLES
g.gui.animation raster=rmap1,rmap2,rmap3

g.gui.animation vector=vmap1,vmap2,vmap3

g.gui.animation strds=precipitation_2000_2010
g.gui.animation raster=`g.list type=raster mapset=. separator=comma pattern="precip*"`
g.gui.animation raster=`g.list -e type=raster mapset=. separator=comma pattern="precip_total.(199[7-9]|200[0-9]|201[0-2]).sum"`
SEE ALSO
wxGUIwxGUI components
g.gui.timeline, g.list, m.nviz.image
See also related wiki page.
AUTHOR
Anna Kratochvilova, Czech Technical University in Prague, Czech RepublicSOURCE CODE
Available at: wxGUI Animation tool source code (history)
Latest change: Saturday Jul 16 18:18:43 2022 in commit: effc544b795cef89a0c38628eee513eca82c266e
Main index | GUI index | Topics index | Keywords index | Graphical index | Full index
© 2003-2023 GRASS Development Team, GRASS GIS 7.8.9dev Reference Manual