Note: This document is for an older version of GRASS GIS that has been discontinued. You should upgrade, and read the current manual page.
NAME
g.gui.tplot - Plots the values of temporal datasets.KEYWORDS
general, GUI, temporal, plotSYNOPSIS
g.gui.tplot
g.gui.tplot --helpg.gui.tplot [-h] [stvds=name[,name,...]] [strds=name[,name,...]] [coordinates=east,north] [cats=string] [attr=string] [output=name] [csv=name] [title=string] [xlabel=string] [ylabel=string] [size=string] [--overwrite] [--help] [--verbose] [--quiet] [--ui]
Flags:
- -h
- Set the header of CSV file, to be used with csv option
- --overwrite
- Allow output files to overwrite existing files
- --help
- Print usage summary
- --verbose
- Verbose module output
- --quiet
- Quiet module output
- --ui
- Force launching GUI dialog
Parameters:
- stvds=name[,name,...]
- Name of the input space time vector datasets
- strds=name[,name,...]
- Name of the input space time raster datasets
- coordinates=east,north
- Coordinates
- cats=string
- Categories of vectores features
- To use only with stvds
- attr=string
- Name of attribute
- Name of attribute which represent data for plotting
- output=name
- Name for output graphical file
- Full path for output file containing the plot, ddd extension to specify format (.png, .pdf, .svg)
- csv=name
- Name for output CSV file
- Full path for the CSV file containing the plotted data
- title=string
- Title for plot
- The title for the output plot
- xlabel=string
- Label for x axis
- The x axis label for the output plot
- ylabel=string
- Label for y axis
- The y axis label for the output plot
- size=string
- The size for output image
- It works only with output parameter
Table of contents
DESCRIPTION
The Temporal Plot Tool is a wxGUI component that queries and plots the values of a point, defined by a coordinate pair, in one or more temporal datasets (strds, stvds, str3ds).Supported features:
- temporal datasets with interval/point and absolute/relative time,
- pop-up annotations with values information,
- query and plot multiple points via the command line,
- zoom and pan,
- change labels to x and y axes,
- add title to the plot, and
- export the time series values to a CSV file.
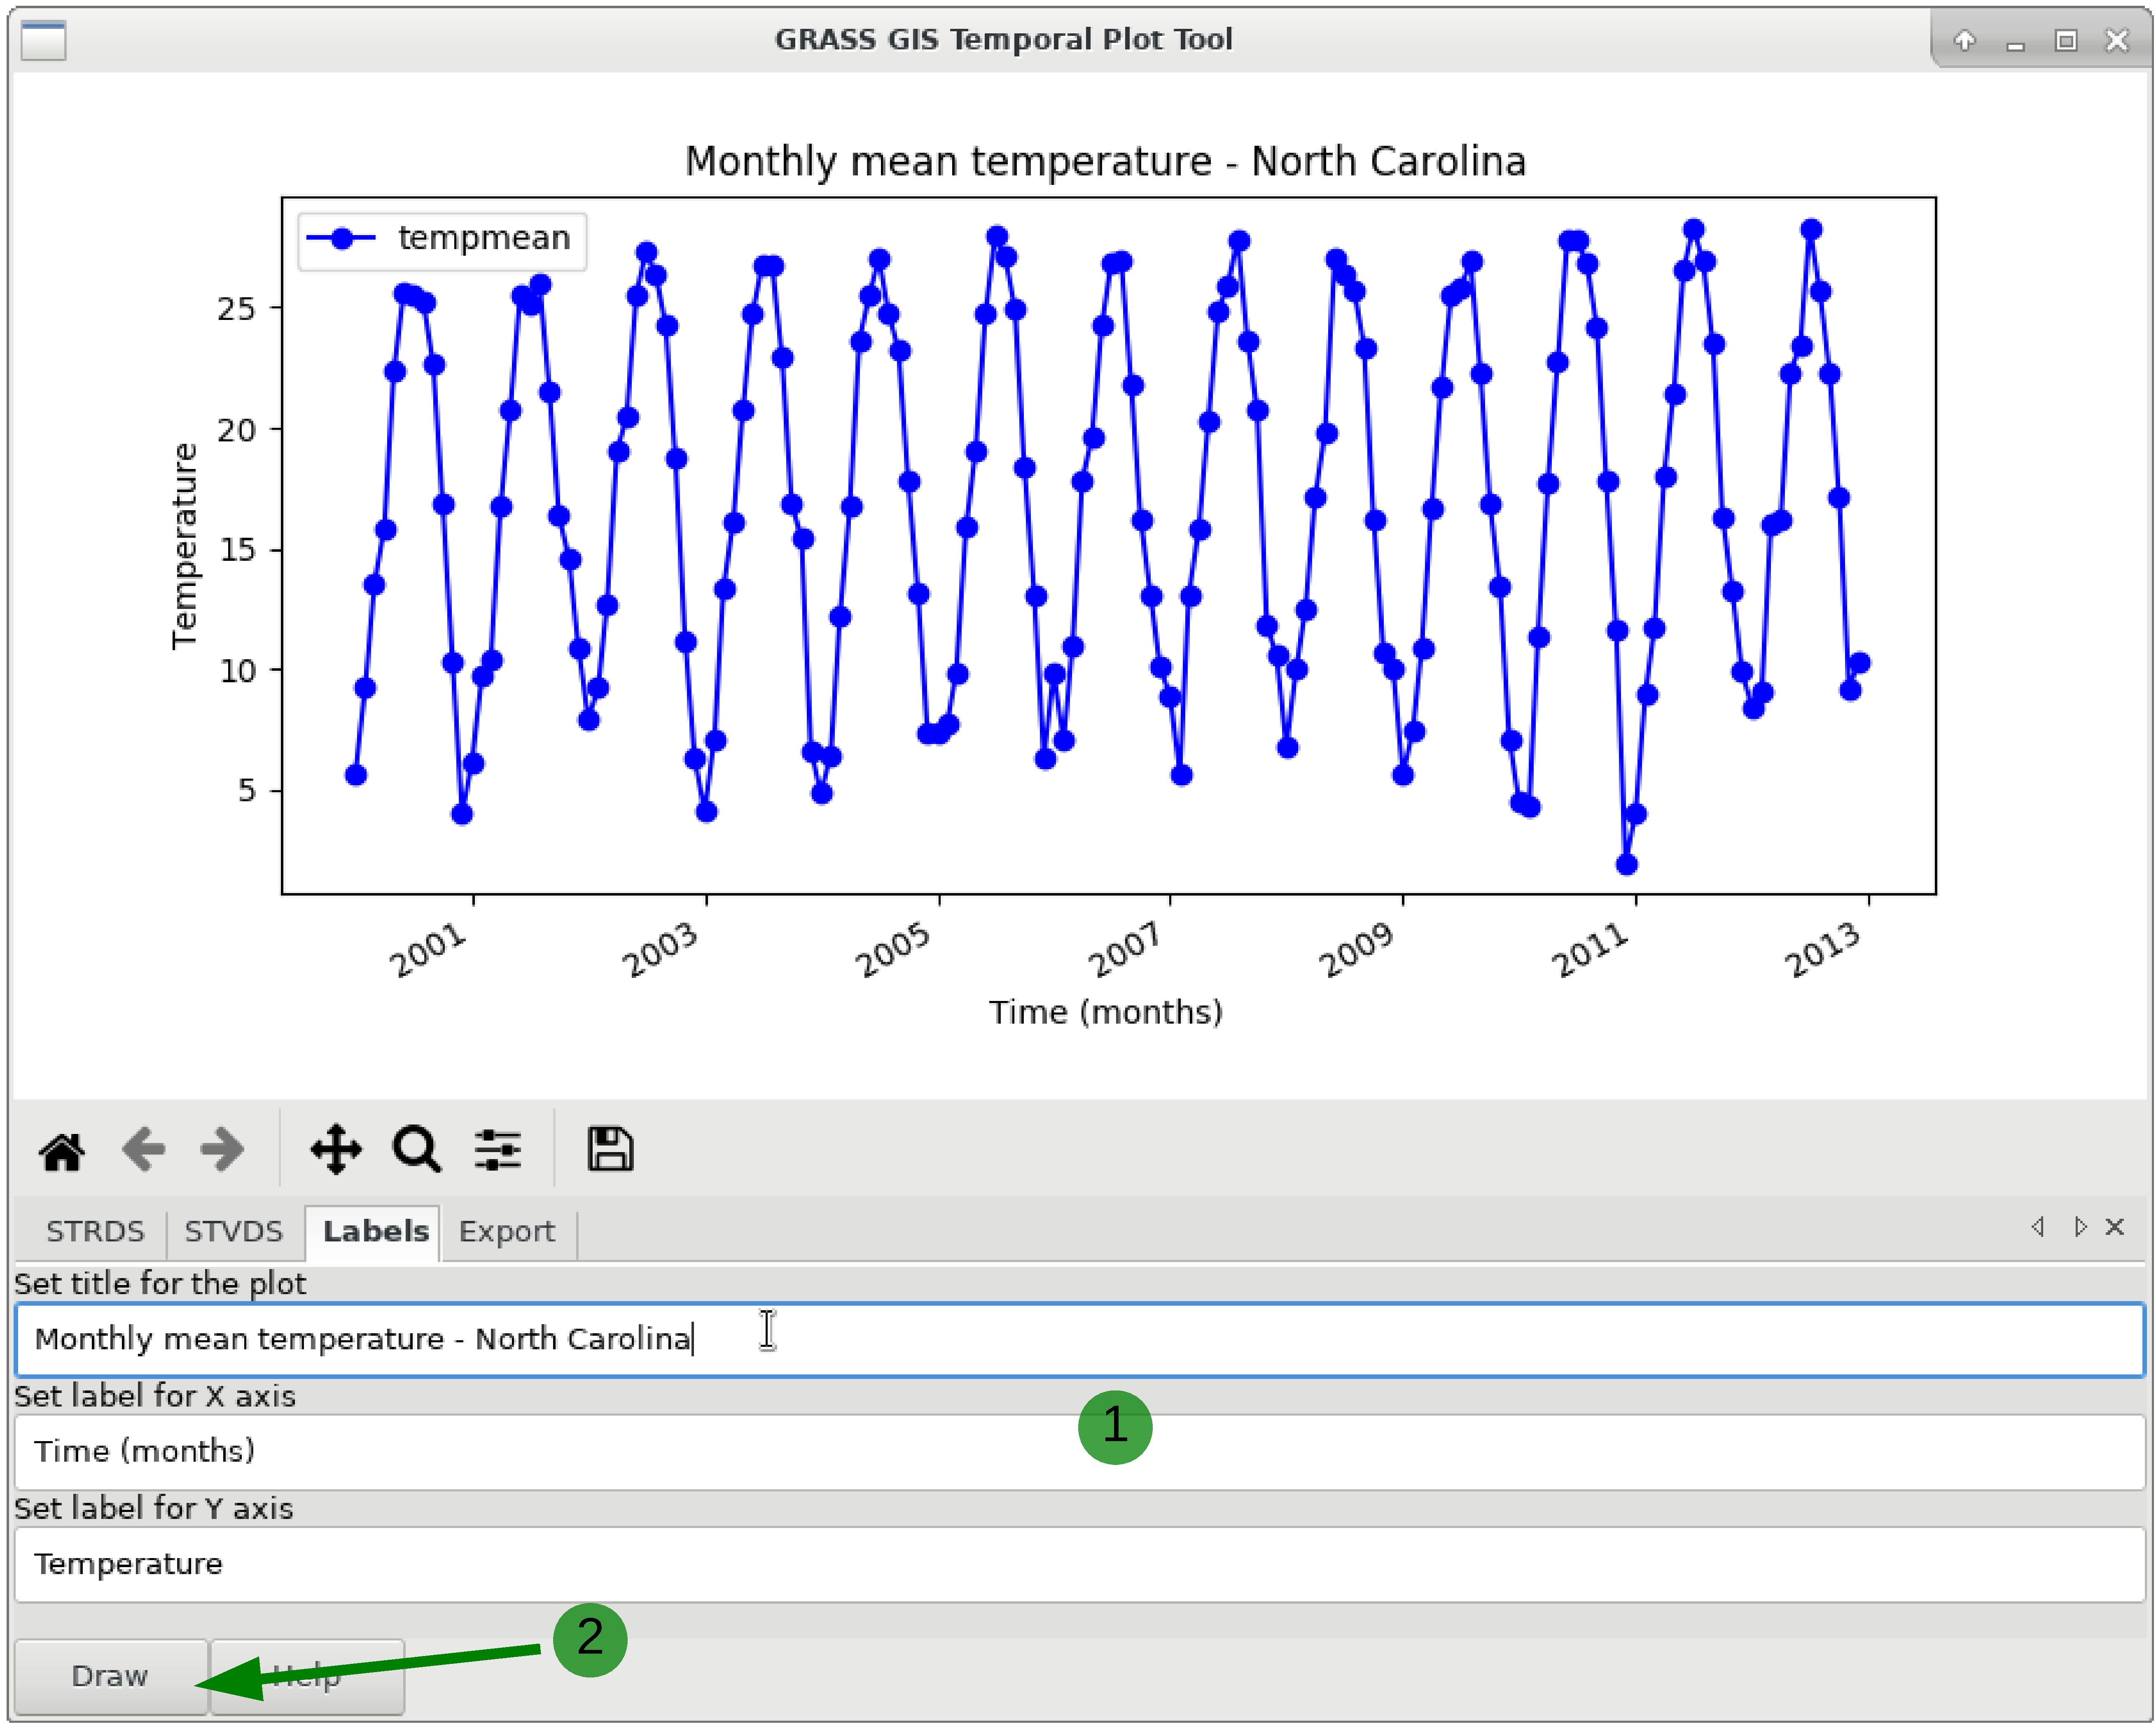
Figure: Temporal Plot Tool
Figure: Add title and labels to a time series plot

Figure: Export time series values to a text file
NOTES
g.gui.tplot requires the Python plotting library Matplotlib.SEE ALSO
Temporal data processingwxGUI
wxGUI components
AUTHOR
Luca Delucchi, Fondazione Edmund Mach, ItalySOURCE CODE
Available at: wxGUI Temporal Plot Tool source code (history)
Latest change: Saturday Jul 16 18:18:43 2022 in commit: effc544b795cef89a0c38628eee513eca82c266e
Main index | GUI index | Topics index | Keywords index | Graphical index | Full index
© 2003-2023 GRASS Development Team, GRASS GIS 7.8.9dev Reference Manual