d.vect.thematic2
Displays thematic map created from vector features and numeric attributes.
d.vect.thematic2 [-glfsm] map=name [layer=string] column=name [type=string [,string,...]] [where=sql_query] themetype=string themecalc=string [breakpoints=string] [icon=string] [size=float] [maxsize=float] [nint=integer] colorscheme=string [point_color=string] [line_color=string] [start_color=string] [end_color=string] [monitor=string] [psmap=string] [group=name] [rgb_column=name] [--verbose] [--quiet] [--qq] [--ui]
Example:
d.vect.thematic2 map=name column=name themetype=graduated_colors themecalc=interval colorscheme=blue-red
grass.tools.Tools.d_vect_thematic2(map, layer="1", column, type="point,line,area", where=None, themetype="graduated_colors", themecalc="interval", breakpoints=None, icon="basic/circle", size=5, maxsize=20, nint=4, colorscheme="blue-red", point_color="255:0:0", line_color="0:0:0", start_color="255:0:0", end_color="0:0:255", monitor="wx1", psmap=None, group=None, rgb_column=None, flags=None, verbose=None, quiet=None, superquiet=None)
Example:
tools = Tools()
tools.d_vect_thematic2(map="name", column="name", themetype="graduated_colors", themecalc="interval", colorscheme="blue-red")
This grass.tools API is experimental in version 8.5 and expected to be stable in version 8.6.
grass.script.parse_command("d.vect.thematic2", map, layer="1", column, type="point,line,area", where=None, themetype="graduated_colors", themecalc="interval", breakpoints=None, icon="basic/circle", size=5, maxsize=20, nint=4, colorscheme="blue-red", point_color="255:0:0", line_color="0:0:0", start_color="255:0:0", end_color="0:0:255", monitor="wx1", psmap=None, group=None, rgb_column=None, flags=None, verbose=None, quiet=None, superquiet=None)
Example:
gs.parse_command("d.vect.thematic2", map="name", column="name", themetype="graduated_colors", themecalc="interval", colorscheme="blue-red")
Parameters
map=name [required]
Name of vector map
Or data source for direct OGR access
layer=string
Layer number or name
Vector features can have category values in different layers. This number determines which layer to use. When used with direct OGR access this is the layer name.
Default: 1
column=name [required]
Name of attribute column to use for thematic display (must be numeric)
type=string [,string,...]
Input feature type
Allowed values: point, line, boundary, centroid, area
Default: point,line,area
where=sql_query
WHERE conditions of SQL statement without 'where' keyword
Example: income < 1000 and population >= 10000
themetype=string [required]
Type of thematic display
Allowed values: graduated_colors, graduated_points, graduated_lines
Default: graduated_colors
themecalc=string [required]
Thematic divisions of data for display
Allowed values: interval, std_deviation, quartiles, custom_breaks
Default: interval
breakpoints=string
Break points for custom breaks option
Separate values by spaces (0 10 20 30 ...)
icon=string
Vector point icon for point data
Allowed values: basic/box, basic/circle, basic/cross2, basic/diamond, basic/star, basic/cross1, basic/x
Default: basic/circle
size=float
Icon size for point data
Minimum icon size/line width for graduated points/lines)
Default: 5
maxsize=float
Maximum icon size/line width for graduated points and lines
Default: 20
nint=integer
Number of classes for interval theme (integer)
Default: 4
colorscheme=string [required]
Color scheme for graduated color mapping
Select 'single_color' for graduated point/line display
Allowed values: blue-red, red-blue, green-red, red-green, blue-green, green-blue, cyan-yellow, yellow-cyan, custom_gradient, single_color
Default: blue-red
point_color=string
Color for graduated points map
GRASS named color or R:G:B triplet. Set color scheme to single color
Default: 255:0:0
line_color=string
Color for graduated lines or point/area outlines
GRASS named color or R:G:B triplet. Set color scheme to single color.
Default: 0:0:0
start_color=string
Beginning color for custom color gradient
Must be expressed as R:G:B triplet
Default: 255:0:0
end_color=string
Ending color for custom color gradient
Must be expressed as R:G:B triplet
Default: 0:0:255
monitor=string
Select WXGUI display monitor for legend
Allowed values: wx0, wx1, wx2, wx3, wx4, wx5, wx6, none
Default: wx1
psmap=string
Root for the name of psmap instruction files to be in current directory
If not set, no psmap instruction files will be created)
group=name
Name of group file where thematic map commands will be saved
rgb_column=name
Name of color column to populate RGB values
-g
Save thematic map commands to group file for GIS Manager
-l
Create graphic legend in x11 display monitor
-f
Only draw fills (no outlines) for areas and points
-s
Output legend for GIS Manager (for scripting use only)
-m
Use math notation brackets in legend
--help
Print usage summary
--verbose
Verbose module output
--quiet
Quiet module output
--qq
Very quiet module output
--ui
Force launching GUI dialog
map : str, required
Name of vector map
Or data source for direct OGR access
Used as: input, vector, name
layer : str, optional
Layer number or name
Vector features can have category values in different layers. This number determines which layer to use. When used with direct OGR access this is the layer name.
Used as: input, layer
Default: 1
column : str, required
Name of attribute column to use for thematic display (must be numeric)
Used as: input, dbcolumn, name
type : str | list[str], optional
Input feature type
Allowed values: point, line, boundary, centroid, area
Default: point,line,area
where : str, optional
WHERE conditions of SQL statement without 'where' keyword
Example: income < 1000 and population >= 10000
Used as: input, sql_query, sql_query
themetype : str, required
Type of thematic display
Allowed values: graduated_colors, graduated_points, graduated_lines
Default: graduated_colors
themecalc : str, required
Thematic divisions of data for display
Allowed values: interval, std_deviation, quartiles, custom_breaks
Default: interval
breakpoints : str, optional
Break points for custom breaks option
Separate values by spaces (0 10 20 30 ...)
icon : str, optional
Vector point icon for point data
Allowed values: basic/box, basic/circle, basic/cross2, basic/diamond, basic/star, basic/cross1, basic/x
Default: basic/circle
size : float, optional
Icon size for point data
Minimum icon size/line width for graduated points/lines)
Default: 5
maxsize : float, optional
Maximum icon size/line width for graduated points and lines
Default: 20
nint : int, optional
Number of classes for interval theme (integer)
Default: 4
colorscheme : str, required
Color scheme for graduated color mapping
Select 'single_color' for graduated point/line display
Allowed values: blue-red, red-blue, green-red, red-green, blue-green, green-blue, cyan-yellow, yellow-cyan, custom_gradient, single_color
Default: blue-red
point_color : str, optional
Color for graduated points map
GRASS named color or R:G:B triplet. Set color scheme to single color
Default: 255:0:0
line_color : str, optional
Color for graduated lines or point/area outlines
GRASS named color or R:G:B triplet. Set color scheme to single color.
Default: 0:0:0
start_color : str, optional
Beginning color for custom color gradient
Must be expressed as R:G:B triplet
Default: 255:0:0
end_color : str, optional
Ending color for custom color gradient
Must be expressed as R:G:B triplet
Default: 0:0:255
monitor : str, optional
Select WXGUI display monitor for legend
Allowed values: wx0, wx1, wx2, wx3, wx4, wx5, wx6, none
Default: wx1
psmap : str, optional
Root for the name of psmap instruction files to be in current directory
If not set, no psmap instruction files will be created)
group : str, optional
Name of group file where thematic map commands will be saved
Used as: input, group, name
rgb_column : str, optional
Name of color column to populate RGB values
Used as: input, dbcolumn, name
flags : str, optional
Allowed values: g, l, f, s, m
g
Save thematic map commands to group file for GIS Manager
l
Create graphic legend in x11 display monitor
f
Only draw fills (no outlines) for areas and points
s
Output legend for GIS Manager (for scripting use only)
m
Use math notation brackets in legend
verbose : bool, optional
Verbose module output
Default: None
quiet : bool, optional
Quiet module output
Default: None
superquiet : bool, optional
Very quiet module output
Default: None
Returns:
result : grass.tools.support.ToolResult | None
If the tool produces text as standard output, a ToolResult object will be returned. Otherwise, None will be returned.
Raises:
grass.tools.ToolError: When the tool ended with an error.
map : str, required
Name of vector map
Or data source for direct OGR access
Used as: input, vector, name
layer : str, optional
Layer number or name
Vector features can have category values in different layers. This number determines which layer to use. When used with direct OGR access this is the layer name.
Used as: input, layer
Default: 1
column : str, required
Name of attribute column to use for thematic display (must be numeric)
Used as: input, dbcolumn, name
type : str | list[str], optional
Input feature type
Allowed values: point, line, boundary, centroid, area
Default: point,line,area
where : str, optional
WHERE conditions of SQL statement without 'where' keyword
Example: income < 1000 and population >= 10000
Used as: input, sql_query, sql_query
themetype : str, required
Type of thematic display
Allowed values: graduated_colors, graduated_points, graduated_lines
Default: graduated_colors
themecalc : str, required
Thematic divisions of data for display
Allowed values: interval, std_deviation, quartiles, custom_breaks
Default: interval
breakpoints : str, optional
Break points for custom breaks option
Separate values by spaces (0 10 20 30 ...)
icon : str, optional
Vector point icon for point data
Allowed values: basic/box, basic/circle, basic/cross2, basic/diamond, basic/star, basic/cross1, basic/x
Default: basic/circle
size : float, optional
Icon size for point data
Minimum icon size/line width for graduated points/lines)
Default: 5
maxsize : float, optional
Maximum icon size/line width for graduated points and lines
Default: 20
nint : int, optional
Number of classes for interval theme (integer)
Default: 4
colorscheme : str, required
Color scheme for graduated color mapping
Select 'single_color' for graduated point/line display
Allowed values: blue-red, red-blue, green-red, red-green, blue-green, green-blue, cyan-yellow, yellow-cyan, custom_gradient, single_color
Default: blue-red
point_color : str, optional
Color for graduated points map
GRASS named color or R:G:B triplet. Set color scheme to single color
Default: 255:0:0
line_color : str, optional
Color for graduated lines or point/area outlines
GRASS named color or R:G:B triplet. Set color scheme to single color.
Default: 0:0:0
start_color : str, optional
Beginning color for custom color gradient
Must be expressed as R:G:B triplet
Default: 255:0:0
end_color : str, optional
Ending color for custom color gradient
Must be expressed as R:G:B triplet
Default: 0:0:255
monitor : str, optional
Select WXGUI display monitor for legend
Allowed values: wx0, wx1, wx2, wx3, wx4, wx5, wx6, none
Default: wx1
psmap : str, optional
Root for the name of psmap instruction files to be in current directory
If not set, no psmap instruction files will be created)
group : str, optional
Name of group file where thematic map commands will be saved
Used as: input, group, name
rgb_column : str, optional
Name of color column to populate RGB values
Used as: input, dbcolumn, name
flags : str, optional
Allowed values: g, l, f, s, m
g
Save thematic map commands to group file for GIS Manager
l
Create graphic legend in x11 display monitor
f
Only draw fills (no outlines) for areas and points
s
Output legend for GIS Manager (for scripting use only)
m
Use math notation brackets in legend
verbose : bool, optional
Verbose module output
Default: None
quiet : bool, optional
Quiet module output
Default: None
superquiet : bool, optional
Very quiet module output
Default: None
DESCRIPTION
d.vect.thematic2 creates thematic maps from vector features of all types and numeric attributes stored in the attribute table connected to a vector map.
Thematic maps can be displayed by either a graduated color scheme (for all vector types), as graduated icon sizes (for point and centroid types), or graduated line widths (for lines and boundaries with associated attributes), see themetype option for details. The user selects the vector map to be mapped and attribute column from which to derive mapping intervals, and (optionally) the layer for attribute data.
In thematic maps, the color or point size changes for each range of attribute values. Value ranges for thematic mapping can be set at regular intervals, standard deviation units on either side of the mean, quartiles, or delimited by user-defined breakpoints, see themecalc option. User-defined breakpoints (themecalc=custom_breaks) can be entered via breakpoints option.
NOTES
There is option colorscheme to define the color scheme (graduated colors) and range of point sizes (graduated points) for thematic maps.
Optionally, a simple text legend is printed when -l flag is given. A graphic legend can be drawn in the selected display monitor.
Thematic colors can be uploaded by rgb_column option to a specified attribute column (which is created automatically if doesn't exist in the table) for later display via d.vect and rgb_column option.
When the psmap option is set to 'name', two psmap instruction files are created (in the current directory if no path is given), one for the map ('name.psmap') and one for the legend ('name_legend.psmap'). The map file also contains 'label' commands which allow to create a legend directly in the map by adding a 'vlegend' command. See the ps.map manual page for more details.
The algorithm currently uses the v.univar to calculate basic descriptive statistics needed for thematic mapping (minimum, maximum, mean, standard deviation, and quartiles).
EXAMPLES
Earthquake points with color gradient:
d.vect.thematic2 -l recent_earthquakes column=magnitude type=point
Earthquake points with different sizes:
d.vect.thematic2 -l recent_earthquakes column=magnitude type=point \
                themetype=graduated_points maxsize=15
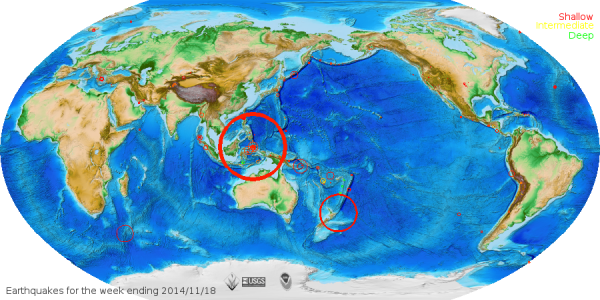
Example for earthquake map rendering (script
code)
North Carolina: differences between 'elevation' (10m) and 'elev_state_500m':
# random sampling of elevation points:
g.region raster=elevation -p
v.random random npoints=200
v.db.addtable random column="el10 double precision"
# transfer elevations to attribute table of random points map:
v.what.rast random rast=elevation column=el10
v.db.select random

# comparative sampling of second map, incl. differences:
v.sample input=random column=el10 raster=elev_state_500m output=elev_sample
v.db.select elev_sample

# univariate statistics:
v.univar -e elev_sample column=diff type=point

# thematic map:
d.mon wx0
d.vect.thematic2 -l elev_sample column=diff type=point
North Carolina sample dataset example:
g.region vector=nc_state
d.vect.thematic2 -l precip_30ynormals column=annual type=point
SEE ALSO
d.vect, d.vect.chart, v.univar
AUTHORS
Michael Barton, Arizona State University
Various updates by:
Daniel Cavelo Aros,
Martin Landa,
Jachym Cepicky
SOURCE CODE
Available at: d.vect.thematic2 source code
(history)
Latest change: Saturday Feb 28 09:16:42 2026 in commit 911fb31