Note: This document is for an older version of GRASS GIS that will be discontinued soon. You should upgrade, and read the current manual page.
NAME
r.series.boxplot - Draws the boxplot of raster values of a series of input rasters.KEYWORDS
display, raster, plot, boxplot, statisticsSYNOPSIS
Flags:
- -o
- Include outliers
- Draw boxplot(s) with outliers
- -n
- Draw the notch
- Draw boxplot(s) with notch
- -h
- Horizontal boxplot(s)
- Draw the boxplot horizontal
- -g
- grid lines
- add grid lines
- --overwrite
- Allow output files to overwrite existing files
- --help
- Print usage summary
- --verbose
- Verbose module output
- --quiet
- Quiet module output
- --ui
- Force launching GUI dialog
Parameters:
- map=name[,name,...] [required]
- input raster
- output=file name
- Name of output image file
- Name for output file
- plot_dimensions=string
- Plot dimensions (width,height)
- Dimensions (width,height) of the figure in inches
- dpi=integer
- DPI
- Set the resolution of plot
- range=float
- Range (value > 0)
- This determines how far the plot whiskers extend out from the box. If range is positive, the whiskers extend to the most extreme data point which is no more than range times the interquartile range from the box. A value of zero causes the whiskers to extend to the data extremes.
- Default: 1.5
- text_labels=string
- Boxplot text labels
- Give labels of the boxplots (comma separated). If you leave this empty, the raster layer names will be used as labels.
- rotate_labels=float
- Rotate labels (degrees)
- Rotate labels (degrees)
- Options: -90-90
- boxplot_width=float
- Set boxplot width
- The width of the boxplots (0,1])
- bxcolor=name
- Boxplot color
- Color of the boxplots. See manual page for color notation options.
- Default: black
- fontsize=integer
- Font size
- Default font size
- flier_marker=string
- Flier marker
- Set flier marker (see https://matplotlib.org/stable/api/markers_api.html for options)
- flier_size=string
- Flier size
- Set flier size
- flier_color=name
- Flier color
- Set flier color
- Default: black
Table of contents
DESCRIPTION
r.seriesboxplot draws boxplots of series of input raster layers. It can be used to display both temporal patterns and spatial variation.The whiskers of the boxplots extend to the most extreme data point, which is no more than range ✕ the interquartile range (iqr) from the box. By default, a range of 1.5 is used, but the user can change this. Note that range values need to be larger than 0. By default, outliers are not included in the plot. Set the -o flag to include them in the plot.
There are a few layout options, including the option to rotate the plot and the x-axis labels, print the boxplot(s) with notches, and define the color of the boxplots.
By default, the raster names are used as labels, but the user can explicitly define the labels (example 3 below). The number of labels need to be the same as the number of input raster layers.
By default, the resulting plot is displayed on screen. However, the user can also save the plot to file using the output option. The format is determined by the extension given by the user. So, if output = outputfile.png, the plot will be saved as a *png* file. The user can set the output size (in inches) and resolution (dpi) of the output image.
NOTE
If you work with a large number of raster layers, of if the raster layers are very large, try to avoid setting the 'range' value very low, as that may result in a massive number of outliers, slowing down the computations and rendering of the plot.EXAMPLE
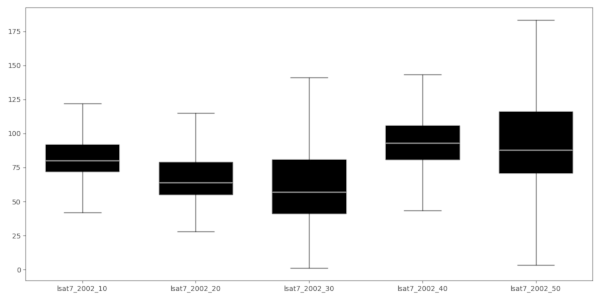
The examples use the North Carolina full dataset, which you can download from [here](https://grass.osgeo.org/download/data/#NorthCarolinaDataset).Example 1
Three landsat layers are provided as input. In addition, plot dimensions are set to 12 inch wide, 6 inch height.r.series.boxplot plot_dimensions=12,6 \ map=lsat7_2002_10,lsat7_2002_20,lsat7_2002_30,lsat7_2002_40,lsat7_2002_50
Example 2
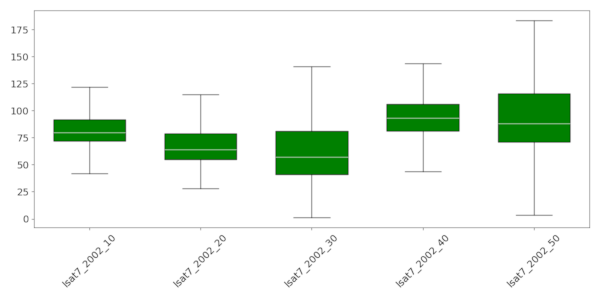
The example below uses the same layers as input. In addition, it defines the colors for the boxplots, rotates the labels and sets the fontsize to 14.r.series.boxplot plot_dimensions=12,6 \ map=lsat7_2002_10,lsat7_2002_20,lsat7_2002_30,lsat7_2002_40,lsat7_2002_50 \ bxcolor=green rotate_labels=45 fontsize=14
See [here](https://matplotlib.org/stable/tutorials/colors/colors.html) for the different formats in which colors can be specified.
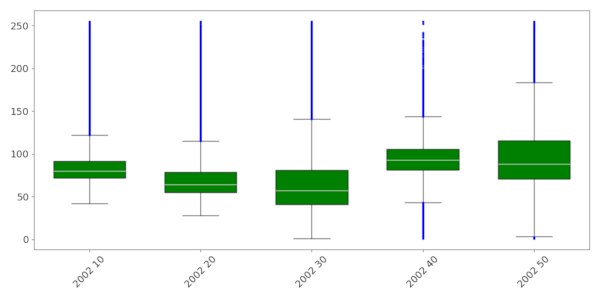
Example 3
Same example as above, but this time, the outliers are plotted as well (in blue). And the labels are explicitly defined.r.series.boxplot -o plot_dimensions=12,6 rotate_labels=45 fontsize=14 \ map=lsat7_2002_10,lsat7_2002_20,lsat7_2002_30,lsat7_2002_40,lsat7_2002_50 \ flier_color=blue bxcolor=green \ text_labels="2002 10,2002 20,2002 30,2002 40,2002 50"
Acknowledgements
This work was carried in the framework of the Save the tiger, save the grassland, save the water project by the Innovative Bio-Monitoring research group of the HAS University of Applied Sciences.SEE ALSO
r.boxplot.html, d.vect.colbp, r.scatterplot, r.stats.zonalAUTHOR
Paulo van BreugelApplied Geo-information Sciences
HAS University of Applied Sciences
SOURCE CODE
Available at: r.series.boxplot source code (history)
Latest change: Tuesday Jun 06 09:22:19 2023 in commit: 70833531f4c3a0ecb542fb957bb0772d63f3dbaf
Note: This document is for an older version of GRASS GIS that will be discontinued soon. You should upgrade, and read the current manual page.
Main index | Raster index | Topics index | Keywords index | Graphical index | Full index
© 2003-2023 GRASS Development Team, GRASS GIS 8.2.2dev Reference Manual