Note: This document is for an older version of GRASS GIS that will be discontinued soon. You should upgrade, and read the current manual page.
NAME
r.survey - Returns maps of visibility indexes from multiple survey pointsKEYWORDS
raster, visibility, survey, parallelSYNOPSIS
Flags:
- -b
- Create a simple visible-not visible raster map
- -c
- Consider the curvature of the earth (current ellipsoid)
- -d
- allow only downward view direction (used for drone view)
- --overwrite
- Allow output files to overwrite existing files
- --help
- Print usage summary
- --verbose
- Verbose module output
- --quiet
- Quiet module output
- --ui
- Force launching GUI dialog
Parameters:
- points=name [required]
- Name of input vector map
- Name of the input points map (survey location)
- dem=name [required]
- Name of the input DEM layer
- output=name [required]
- Prefix for the output visibility layers
- maxdist=float [required]
- max distance from the input points
- Default: 1000
- treesmap=name
- Name of input vector map
- Name of the vector layer representing the forested areas
- buildingsmap=name
- Name of input vector map
- Name of the vector layer representing the buildings
- obs_heigh=float [required]
- observer_elevation
- Default: 1.75
- treesheigh=string
- field of the table with average threes heigh
- treesheighdeviation=string
- field of the table with standard deviation value of the heigh
- buildingsheigh=string
- field of the tablewith buildings heigh
- obsabselev=string
- field of the table with observer absolute elevation
- layer=string
- layer of the table of the point map
- Default: 1
- viewangle_threshold=float [required]
- cut the output layers at a given threshold value
- Default: 90
- object_radius=float
- radius of the surveyed object (default 0.5 * DEM resolution)
- nprocs=integer
- Number of processes
- Default: 1
- memory=integer
- Amount of memory to use in MB (for r.viewshed analysis)
- Default: 500
Table of contents
DESCRIPTION
r.survey is aimed at earth surface analysis. It is useful for evaluating the visibility (in terms of 3D Distance, Solid Angle and orientation of the terrain respect to the line of sight) of features lying on the terrain slope, like landslides, road cuts, minor vegetation, mining activity, geological outcrops, surface pipelines, parking areas, solar panels plants, burned areas, etc.Depending on the purpose of the study, one can be interested in searching the closest position to observe a given territory while for others, having a frontal view can be more relevant. In some cases, the objective could be the combined balance between the closest and the most frontal view, in order to evaluate how much of the human field of view is occupied by a given object (solid angle).
r.survey is deeply based on the powerful r.viewshed GRASS GIS module.
r.survey wants to provide the user the necessary information to answer questions such as:
- In a survey trip, from how many places is something visible?
- During a field work, which place would be the best position to observe a given point/area (according to the distance, the angle or both)?
- Which portion of the territory is visible along a survey path/flight?
- Are objects of a given size visible from a survey path/flight?
A map containing a set of points describing the locations of the observer and a digital elevation model (DEM) are the mandatory inputs for r.survey. It is very importante that all observation points have different categories, i.e. cat values (see the examples below). In addition, maps of buildings and trees, portraying height information, can be used to alter the DEM. In the case of trees map, apart from the height value, a third column in the attribute table has to contain the standard deviation value related to the heigh. This is used to simulate the rougness of forested areas.
Many other options can be set according to the aim of the analysis, such as: observer height respect to the ground or respect to an elevation datum (absolute elevation), maximum distance to perform the calculations, a view-angle threshold to exclude, a priori, cell oriented almost perpendicularly to the lines of sight, the average size of the observed object. The input points map must be provided to the tool as a vector layer. In case it represents the positions of a UAV, an helicopter or of a satellite, it must include an attribute field containing absolute elevation values with respect to a vertical datum (the same datum used by the input DEM). Observer height (respect to the ground, the default is 1.75 m) and maximum distance of observation (default is 1000 m) are parameters needed by the r.viewshed module. The object radius is used to approximate, with an equivalent circle, the minimum size of an object centered in the cells center and oriented according to the slope and aspect of the cells. Since r.survey produces different types of outputs, a name to be used for the prefix of the output maps is requested.
3D Distance is the three dimensional linear distance between a viewpoint and a target pixel (see the illutratio bellow). The min3dDistance map portrays the value of the minimum three-dimensional distance between each pixel and the closest viewpoint, in meters.
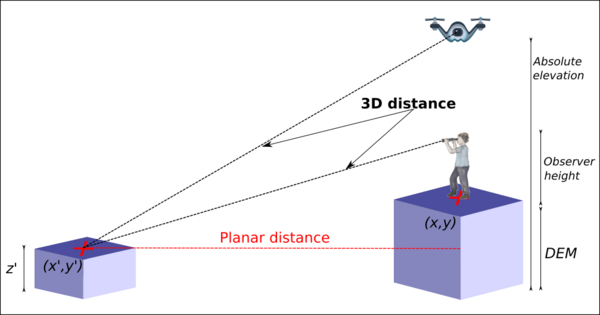
Figure: 3D distance
Given a viewpoint, r.survey calculate the unit vector describing direction and sense of the line of sight between that viewpoint and each visible pixel (see illustration bellow). We define View Angle as the angle between the unit vector representing the line of sight and the unit vector normal to the terrain surface in each pixel. The maxViewAngle map shows the value of the maximum View Angle between each pixel and the viewpoints, in degrees. It is a measure of the most frontal view each single cell is visible from. View angle output is always larger than 90° and smaller than 180°.
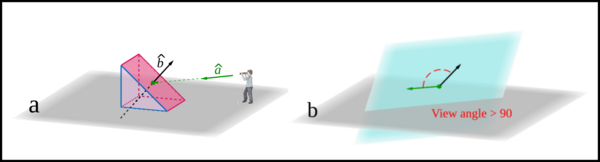
Figure: View angle
Solid Angle is one of the best and most objective indicators for quantifying the visibility. The idea is that any observed object will be progressively less appreciable the more far away and the more tilted it is with regard to the viewpoint. As a consequence Solid Angle depends on the size of the observed object as well as on the distance and the orientation from where this object is observed. Solid Angle of a surface is, by definition, equal to the projected spherical surface in the evolving sphere divided by the square of the radius of the sphere. As an aproximation, we use the ellipse surface area in place of the projected spherical surface in the evolving sphere. The maxSolidAngle map shows the value of the maximum Solid Angle (expressed in steradians) among those measured from the different viewpoints. In this map, the closest pixels to the observation points have to be interpreted with special attention, considering that the error, respect to the real Solid Angle, can reach until the 10% in the immediate neighbor pixels. For reference: 1 sr is equal to approximately 3283 (deg2) square degrees and to 1.18 x 10⁷ square minutes (min2). It means that 2 x 10⁻⁶ sr = 23.6 min2. For comparison, letter acuity (the capacity to resolve a letter) is approximately 25 min2 for a human with perfect vision and in controlled conditions, that is, high contrast between the letters and the background.
Other three maps (pointOfViewWithMin3dDistance, pointOfViewWithMmaxAngle and pointOfViewWithMmaxSolidAngle) are used to register, in each cell, the identifier of the viewpoints from where an observer can get, respectively, (i) the minimum values of 3D Distance, (ii) the maximum values of View Angle and (iii) the maximum value of the Solid Angle. Another relevant output is the numberOfViews map which portraits the number of viewpoints from where each pixel is visible.
NOTES
The software was designed as a GRASS GIS python module whose source code was written using the GRASS Scripting library and the pyGRASS library.Multi-core processing is used by r.survey for reducing the computational time. When the aim is to derive the values of the visibility indexes along a given path (e.g. a road or a UAV track) viewpoints can be very dense in terms of number per unit of distance and the more the viewpoints are, the longer the computational time becomes.
Parallel computation was implemented exploiting the Python Multiprocessing library and the ability of GRASS GIS to set a temporary spatial region centered on the considered point without affecting the parallel computation of the other points.
EXAMPLES
The location used for the following examples can be downloaded here. The name is R.SURVEY_LocationVisibility from roads
The most common usage of this tool is to model the visibility from the roads, for which a set of points located along the roads is needed. We are going to create a sample of points each 50 meters along the road.g.region raster=dem v.build.polylines input=roads output=roads_poly cats=multi # Convert the road layer into polyline v.to.points input=roads_poly output=points_50 dmax=50 # A point is created each 50 meters ## Ensure that each point has an independent category value ## v.category input=points_50 output=points_50_del option=del cat=-1 v.category input=points_50_del output=points_50_add option=add cat=1
Running r.survey in parallel
This example shows how to run r.survey calculating the solid angle for an object of radius equal to 20 m and using 4 parallel processes. The height of a tower is considered as well into the calculations.g.region raster=Synthetic_valley r.survey points=Two_viewpoints dem=Synthetic_valley output=example maxdist=3000 buildingsmap=Tower buildingsheigh=Altitude object_radius=20 nprocs=4
Filter output by a view angle threshold
This example shows how to run r.survey calculating the same layers as in example 1, but this time the outputs are filtered by a View Angle threshold of 100 degrees.g.region raster=Synthetic_valley r.survey points=Two_viewpoints dem=Synthetic_valley output=example2 maxdist=3000 buildingsmap=Tower buildingsheigh=Altitude object_radius=20 nprocs=4 viewangle_threshold=100
Using r.survey in flight mode and with the downward view
This example shows how to run r.survey in flight mode and with the downward view. The observation points correspond for the path of an UAV flying in a irregular height above the ground. A field with the points altitude information (above de sea level) is mandatory.g.region raster=Synthetic_valley r.survey -d points=Flight_viewpoints dem=Synthetic_valley output=example3 maxdist=3000 nprocs=4 obsabselev=Elevation
REFERENCES
- Bornaetxea, T., Marchesini, I. r.survey: a tool for calculating visibility of variable-size objects based on orientation, International Journal of Geographical Information Science, https://www.tandfonline.com/doi/full/10.1080/13658816.2021.1942476
SEE ALSO
r.viewshed, r.viewshed.cva, r.viewshed.exposureAUTHORS
Ivan Marchesini - Research Institute for Geo-Hydrological Protection (IRPI) - Italian National Research Council (CNR), Perugia, Italy. E-mail: ivan.marchesini@irpi.cnr.it. ORCiD: 0000-0002-8342-3134Txomin Bornaetxea - Department of Geology, University of the Basque Country (UPV/EHU), Leioa, Spain. E-mail: txomin.bornaetxea@ehu.eus. ORCiD: 0000-0002-1540-3991
SOURCE CODE
Available at: r.survey source code (history)
Latest change: Monday Jan 30 19:52:26 2023 in commit: cac8d9d848299297977d1315b7e90cc3f7698730
Note: This document is for an older version of GRASS GIS that will be discontinued soon. You should upgrade, and read the current manual page.
Main index | Raster index | Topics index | Keywords index | Graphical index | Full index
© 2003-2023 GRASS Development Team, GRASS GIS 8.2.2dev Reference Manual