Note: This document is for an older version of GRASS GIS that will be discontinued soon. You should upgrade, and read the current manual page.
NAME
r.cpt2grass - Convert or apply a GMT color table to a GRASS raster mapKEYWORDS
SYNOPSIS
r.cpt2grass
r.cpt2grass --helpr.cpt2grass [-s] [input=name] [url=string] [map=name] [output=name] [--overwrite] [--help] [--verbose] [--quiet] [--ui]
Flags:
- -s
- Stretch color scale to match map data extent
- --overwrite
- Allow output files to overwrite existing files
- --help
- Print usage summary
- --verbose
- Verbose module output
- --quiet
- Quiet module output
- --ui
- Force launching GUI dialog
Parameters:
- input=name
- Name of input GMT color table (.cpt file)
- url=string
- URL of the color table
- map=name
- Raster map to apply it to
- output=name
- Name for new rules file
Table of contents
DESCRIPTION
Module r.cpt2grass converts GMT color palette (*.cpt) format to GRASS color table format and assigns it to a given raster map. Input can be either cpt file given in input option or a URL of the cpt file specified in url option. Specifying URL is particularly useful when using color tables from cpt-city, because many color tables can be quickly tested without downloading the files. When option map is specified r.cpt2grass assigns the color rules to the given raster map. Depending on the values of the original cpt file, it may be advantageous to use the -s to stretch the colors based on the range of values of the map.NOTES
RGB and HSV models are supported. The expected format of the cpt file is:# COLOR_MODEL = RGB value1 R G B value2 R G B value2 R G B value3 R G B ...Named colors are not supported.
EXAMPLES
From cpt-city we download a rainfall color table and convert it to GRASS color table. If we don't specify output file, it is printed to standard output:r.cpt2grass input=rainfall.cpt
0.000 229:180:44
20.000 229:180:44
20.000 242:180:100
40.000 242:180:100
40.000 243:233:119
60.000 243:233:119
60.000 145:206:126
80.000 145:206:126
80.000 67:190:135
100.000 67:190:135
100.000 52:180:133
120.000 52:180:133
120.000 6:155:66
140.000 6:155:66
We set two different elevation color tables - continuous and discrete gradients. We have to stretch the color tables to fit the raster map range:
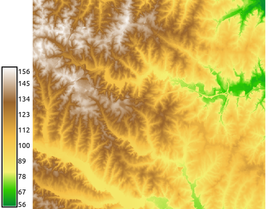
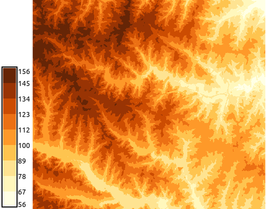
r.cpt2grass url=http://soliton.vm.bytemark.co.uk/pub/cpt-city/td/DEM_screen.cpt map=elevation -s
r.cpt2grass url=http://soliton.vm.bytemark.co.uk/pub/cpt-city/cb/seq/YlOrBr_09.cpt map=elevation -s
d.legend raster=elevation labelnum=10 at=5,50,7,10
SEE ALSO
r.colorsAUTHORS
Anna Petrasova, NCSU OSGeoRELHamish Bowman (original Bash script)
SOURCE CODE
Available at: r.cpt2grass source code (history)
Latest change: Wednesday Jan 18 15:50:17 2023 in commit: 6ab0a680d4154384b6548888f6d70b7946af8a32
Note: This document is for an older version of GRASS GIS that will be discontinued soon. You should upgrade, and read the current manual page.
Main index | Raster index | Topics index | Keywords index | Graphical index | Full index
© 2003-2023 GRASS Development Team, GRASS GIS 8.2.2dev Reference Manual