Note: This document is for an older version of GRASS GIS that has been discontinued. You should upgrade, and read the current manual page.
NAME
i.evapo.time - Computes temporal integration of satellite ET actual (ETa) following the daily ET reference (ETo) from meteorological station(s).KEYWORDS
imagery, evapotranspirationSYNOPSIS
Flags:
- --overwrite
- Allow output files to overwrite existing files
- --help
- Print usage summary
- --verbose
- Verbose module output
- --quiet
- Quiet module output
- --ui
- Force launching GUI dialog
Parameters:
- eta=name[,name,...] [required]
- Names of satellite ETa raster maps [mm/d or cm/d]
- eta_doy=name[,name,...] [required]
- Names of satellite ETa Day of Year (DOY) raster maps [0-400] [-]
- eto=name[,name,...] [required]
- Names of meteorological station ETo raster maps [0-400] [mm/d or cm/d]
- eto_doy_min=float [required]
- Value of DOY for ETo first day
- start_period=float [required]
- Value of DOY for the first day of the period studied
- end_period=float [required]
- Value of DOY for the last day of the period studied
- output=name [required]
- Name for output raster map
Table of contents
DESCRIPTION
i.evapo.time (i.evapo.time_integration) integrates ETa in time following a reference ET (typically) from a set of meteorological stations dataset. Inputs:- ETa images
- ETa images DOY (Day of Year)
- ETo images
- ETo DOYmin as a single value
- each ETa pixel is divided by the same day ETo and become ETrF
- each ETrF pixel is multiplied by the ETo sum for the representative days
- Sum all n temporal [ETrF*ETo_sum] pixels to make a summed(ET) in [DOYmin;DOYmax]
DOYbeforeETa[i] = ( DOYofETa[i] - DOYofETa[i-1] ) / 2
DOYafterETa[i] = ( DOYofETa[i+1] - DOYofETa[i] ) / 2
NOTES
ETo images preparation: If you only have one meteorological station data set, the easiest way is:n=0 for ETo_val in Eto[1] Eto[2] ... do r.mapcalc "eto$n = $ETo_val" `expr n = n + 1` done
If you have several meteorological stations data, then you need to grid them by generating Thiessen polygons or using different interpolation methods for each day.
For multi-year calculations, just continue incrementing DOY values above 366, it will continue working, up to maximum input of 400 satellite images.
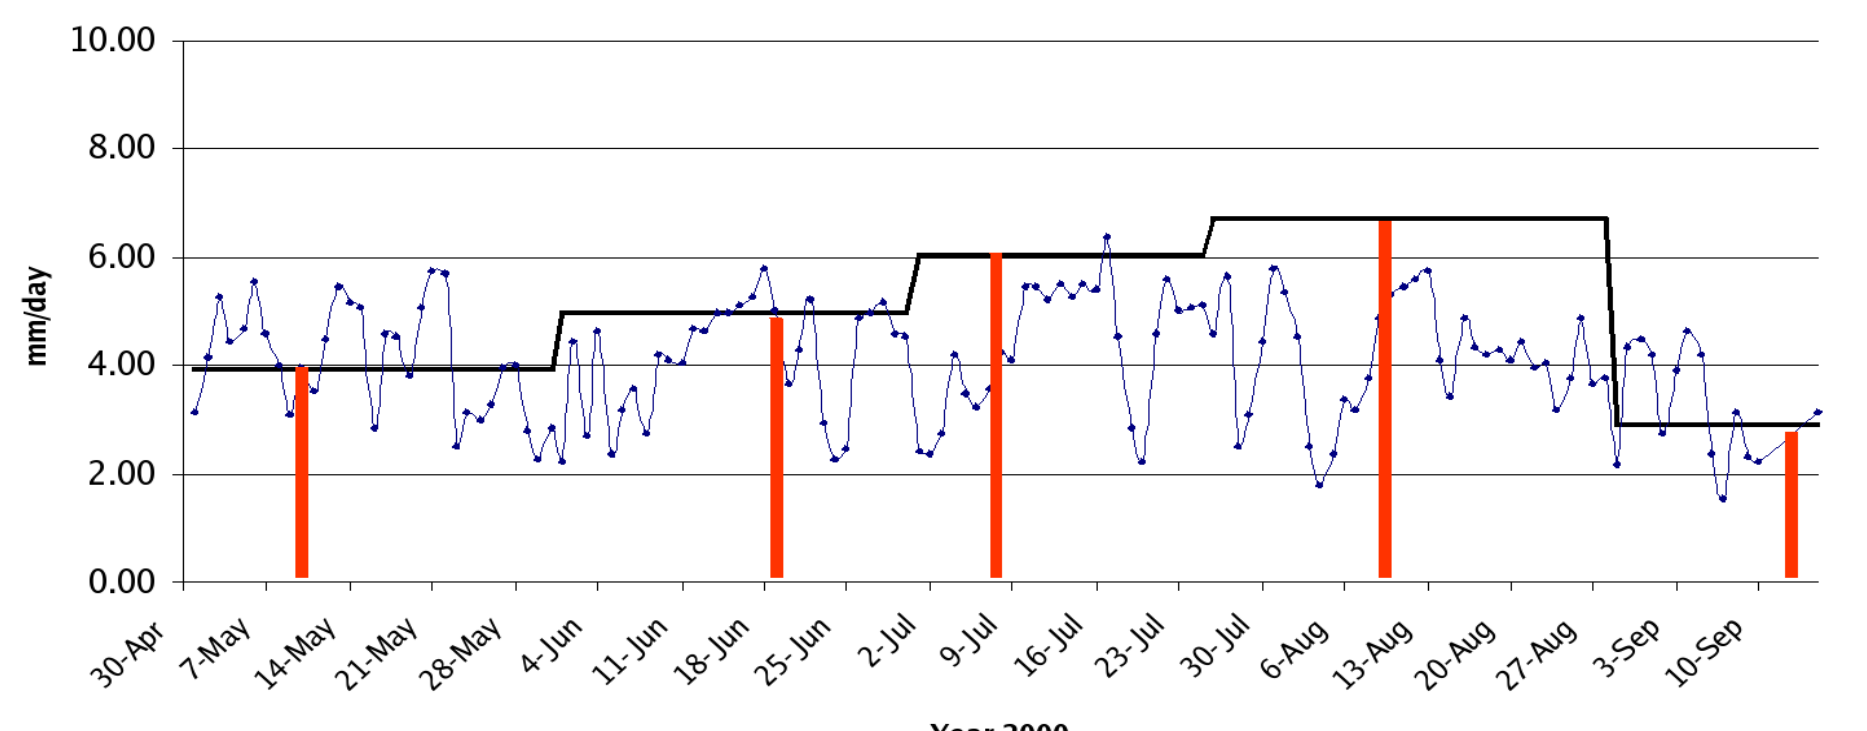
This is an example of a temporal integration from a weather station as done by
Chemin and Alexandridis (2004)
References
Chemin and Alexandridis, 2004. Spatial Resolution Improvement of Seasonal Evapotranspiration for Irrigated Rice, Zhanghe Irrigation District, Hubei Province, China. Asian Journal of Geoinformatics, Vol. 5, No. 1, September 2004 (PDF)
SEE ALSO
i.eb.eta, i.evapo.mh, i.evapo.pt, i.evapo.pm, r.sunAUTHOR
Yann Chemin, International Rice Research Institute, The PhilippinesSOURCE CODE
Available at: i.evapo.time source code (history)
Latest change: Wednesday Dec 27 16:18:17 2023 in commit: 2e4507f76058083509a784e64f9325fdd732aa87
Main index | Imagery index | Topics index | Keywords index | Graphical index | Full index
© 2003-2024 GRASS Development Team, GRASS GIS 8.3.3dev Reference Manual