NAME
v.delaunay - Creates a Delaunay triangulation from an input vector map containing points or centroids.KEYWORDS
vector, geometry, triangulationSYNOPSIS
v.delaunay
v.delaunay --helpv.delaunay [-rl] input=name [layer=string] output=name [--overwrite] [--help] [--verbose] [--quiet] [--ui]
Flags:
- -r
- Use only points in current region
- -l
- Output triangulation as a graph (lines), not areas
- --overwrite
- Allow output files to overwrite existing files
- --help
- Print usage summary
- --verbose
- Verbose module output
- --quiet
- Quiet module output
- --ui
- Force launching GUI dialog
Parameters:
- input=name [required]
- Name of input vector map
- Or data source for direct OGR access
- layer=string
- Layer number or name ('-1' for all layers)
- A single vector map can be connected to multiple database tables. This number determines which table to use. When used with direct OGR access this is the layer name.
- Default: -1
- output=name [required]
- Name for output vector map
Table of contents
DESCRIPTION
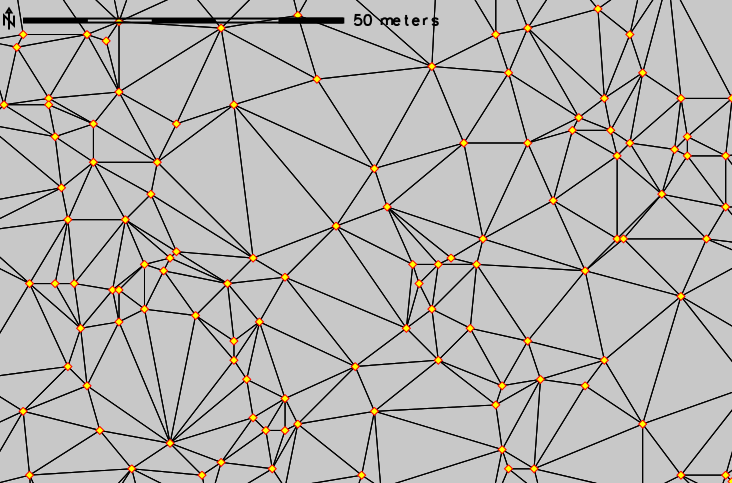
v.delaunay uses an existing vector points map (input) to create a Delaunay triangulation vector map (output).Delaunay triangulation example (red-yellow points are the data points from which the triangulation was generated):
EXAMPLE
Commands used with the North Carolina dataset to create the above figure (subset shown in figure).g.region n=220750 s=219950 w=638300 e=639000 -p v.delaunay input=elev_lid792_randpts output=elev_lid792_randpts_delaunay
REFERENCES
Leonid Guibas and Jorge Stolfi, (1985). Primitives for the Manipulation of General Subdivisions and the Computation of Voronoi Diagrams, ACM Transactions on Graphics, Vol 4, No. 2, April 1985, Pages 74-123SEE ALSO
v.voronoi, v.hullDelaunay triangulation (Wikipedia)
AUTHORS
Martin Pavlovsky, Google Summer of Code 2008, StudentPaul Kelly, Mentor
Based on "dct" by Geoff Leach, Department of Computer Science, RMIT.
SOURCE CODE
Available at: v.delaunay source code (history)
Latest change: Friday Apr 17 01:04:26 2026 in commit: 32a143358df26b2e518b03c7e0d79541e8d1e5b1
Main index | Vector index | Topics index | Keywords index | Graphical index | Full index
© 2003-2026 GRASS Development Team, GRASS 8.5.1dev Reference Manual