NAME
v.boxplot - Draws the boxplot of values in a vector attribute columnKEYWORDS
display, vector, plot, histogram, boxplotSYNOPSIS
Flags:
- -h
- horizontal boxplot(s)
- Draw the boxplot horizontal
- -o
- hide outliers
- Draw boxplot(s) without outliers
- -n
- notch
- Draw boxplot(s) with notch
- -r
- Rotate labels
- rotate x-axis labels
- --overwrite
- Allow output files to overwrite existing files
- --help
- Print usage summary
- --verbose
- Verbose module output
- --quiet
- Quiet module output
- --ui
- Force launching GUI dialog
Parameters:
- map=name [required]
- Name of vector map
- Or data source for direct OGR access
- layer=string
- Layer number or name
- Vector features can have category values in different layers. This number determines which layer to use. When used with direct OGR access this is the layer name.
- Default: 1
- column=name [required]
- Attribute column value to be plotted
- where=sql_query
- WHERE conditions of SQL statement without 'where' keyword
- Example: income < 1000 and population >= 10000
- plot_output=name
- Name for output file
- group_by=name
- Attribute column with categories to group the data by
- order=string
- Sort boxplots
- Sort boxplots based on their median values
- Options: descending, ascending
DESCRIPTION
v.boxplot draws a boxplot of the values in a vector map attribute column. The user can use the where option to only select a subset of the attribute table. There is also the option to group the values of the column according to the categories in a second column (group_by and create one plot with for each group a separate boxplot.
By default, the resulting plot is displayed on screen (default). However, the user can also save the plot to file using the plot_output option. The format is determined by the extension given by the user. So, if plot_output = outputfile.pngtt>, the plot will be saved as a png file.
There are a few additonal layout options, including the option to rotate the plot and the x-axis labels. Furthermore, the user can optinally plot the boxplot(s) with notches and without outliers.
EXAMPLE
Example 1
Use the vector layer schools_wake from the NC sample dataset to create boxplots of the core capacity of the schools in Wake County, North Carolina. Use the Where clause to exclude all records with no data.v.boxplot -n map=schools_wake column=CORECAPACI where="CORECAPACI >0"
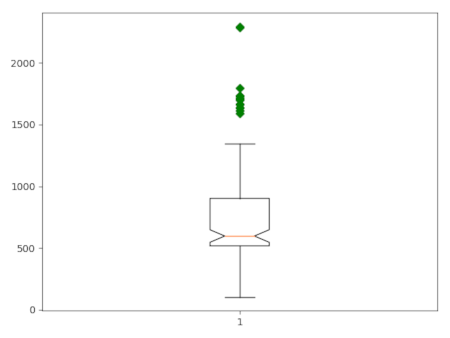
Figure 1: Boxplot of core capacity of schools in Wake County.
Example 2
Use the vector layer schools_wake from the NC sample dataset to create boxplots of the core capacity of the schools in Wake County, North Carolina, grouped by city. Use the Where clause to exclude all records with no data.v.boxplot -h --overwrite map=schools_wake column=CORECAPACI where="CORECAPACI >0" group_by=ADDRCITY order=ascending
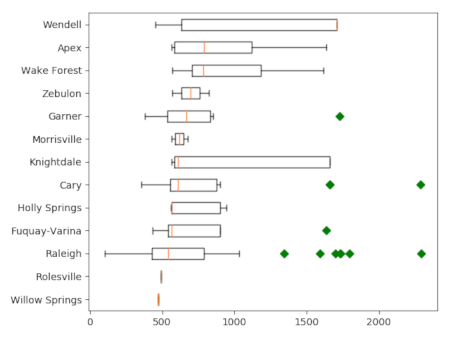
Figure 2: Boxplot of core capacity of schools in Wake County, grouped by city.
SEE ALSO
v.scatterplot, d.vect.colhist, r.boxplot, r.series.boxplot, t.rast.boxplot, r.scatterplot r3.scatterplotAUTHOR
Paulo van BreugelBased on the d.vect.colhist addon by Moritz Lennert
SOURCE CODE
Available at: v.boxplot source code (history)
Latest change: Wednesday Dec 27 19:08:46 2023 in commit: d37ce345dd504649bf3a96072631e46111210718
Main index | Vector index | Topics index | Keywords index | Graphical index | Full index
© 2003-2024 GRASS Development Team, GRASS GIS 8.3.3dev Reference Manual