v.voronoi
Creates a Voronoi diagram constrained to the extents of the current region from an input vector map containing points or centroids.
v.voronoi [-aslt] input=name [layer=string] output=name [smoothness=float] [thin=float] [--overwrite] [--verbose] [--quiet] [--qq] [--ui]
Example:
v.voronoi input=name output=name
grass.tools.Tools.v_voronoi(input, layer="-1", output, smoothness=0.25, thin=-1, flags=None, overwrite=None, verbose=None, quiet=None, superquiet=None)
Example:
tools = Tools()
tools.v_voronoi(input="name", output="name")
This grass.tools API is experimental in version 8.5 and expected to be stable in version 8.6.
grass.script.run_command("v.voronoi", input, layer="-1", output, smoothness=0.25, thin=-1, flags=None, overwrite=None, verbose=None, quiet=None, superquiet=None)
Example:
gs.run_command("v.voronoi", input="name", output="name")
Parameters
input=name [required]
Name of input vector map
Or data source for direct OGR access
layer=string
Layer number or name ('-1' for all layers)
A single vector map can be connected to multiple database tables. This number determines which table to use. When used with direct OGR access this is the layer name.
Default: -1
output=name [required]
Name for output vector map
smoothness=float
Factor for output smoothness
Applies to input areas only. Smaller values produce smoother output but can cause numerical instability.
Default: 0.25
thin=float
Maximum dangle length of skeletons
Applies only to skeleton extraction. Default = -1 will extract the center line.
Default: -1
-a
Create Voronoi diagram for input areas
-s
Extract skeletons for input areas
-l
Output tessellation as a graph (lines), not areas
-t
Do not create attribute table
--overwrite
Allow output files to overwrite existing files
--help
Print usage summary
--verbose
Verbose module output
--quiet
Quiet module output
--qq
Very quiet module output
--ui
Force launching GUI dialog
input : str, required
Name of input vector map
Or data source for direct OGR access
Used as: input, vector, name
layer : str, optional
Layer number or name ('-1' for all layers)
A single vector map can be connected to multiple database tables. This number determines which table to use. When used with direct OGR access this is the layer name.
Used as: input, layer
Default: -1
output : str, required
Name for output vector map
Used as: output, vector, name
smoothness : float, optional
Factor for output smoothness
Applies to input areas only. Smaller values produce smoother output but can cause numerical instability.
Default: 0.25
thin : float, optional
Maximum dangle length of skeletons
Applies only to skeleton extraction. Default = -1 will extract the center line.
Default: -1
flags : str, optional
Allowed values: a, s, l, t
a
Create Voronoi diagram for input areas
s
Extract skeletons for input areas
l
Output tessellation as a graph (lines), not areas
t
Do not create attribute table
overwrite : bool, optional
Allow output files to overwrite existing files
Default: None
verbose : bool, optional
Verbose module output
Default: None
quiet : bool, optional
Quiet module output
Default: None
superquiet : bool, optional
Very quiet module output
Default: None
Returns:
result : grass.tools.support.ToolResult | None
If the tool produces text as standard output, a ToolResult object will be returned. Otherwise, None will be returned.
Raises:
grass.tools.ToolError: When the tool ended with an error.
input : str, required
Name of input vector map
Or data source for direct OGR access
Used as: input, vector, name
layer : str, optional
Layer number or name ('-1' for all layers)
A single vector map can be connected to multiple database tables. This number determines which table to use. When used with direct OGR access this is the layer name.
Used as: input, layer
Default: -1
output : str, required
Name for output vector map
Used as: output, vector, name
smoothness : float, optional
Factor for output smoothness
Applies to input areas only. Smaller values produce smoother output but can cause numerical instability.
Default: 0.25
thin : float, optional
Maximum dangle length of skeletons
Applies only to skeleton extraction. Default = -1 will extract the center line.
Default: -1
flags : str, optional
Allowed values: a, s, l, t
a
Create Voronoi diagram for input areas
s
Extract skeletons for input areas
l
Output tessellation as a graph (lines), not areas
t
Do not create attribute table
overwrite : bool, optional
Allow output files to overwrite existing files
Default: None
verbose : bool, optional
Verbose module output
Default: None
quiet : bool, optional
Quiet module output
Default: None
superquiet : bool, optional
Very quiet module output
Default: None
DESCRIPTION
v.voronoi creates a Voronoi diagram (Thiessen polygons) from points or centroids.
The bounds of the output map are limited by the current region (see g.region).
The -a flag can be used to create a Voronoi diagram for areas.
The -s flag can be used to extract the center line of areas or skeletons of areas with thin >= 0. Smaller values for the thin option will preserve more detail, while negative values will extract only the center line.
NOTES
v.voronoi suffers from numerical instability, results can sometimes contain many artefacts. When creating Voronoi diagrams for areas or skeletons for areas, it is highly recommended to simplify the areas first with v.generalize.
Voronoi diagrams may be used for nearest-neighbor flood filling. Give the centroids attributes (start with v.db.addcolumn), then optionally convert the result to a raster map with v.to.rast.
The extraction of skeletons and center lines with the -s flag is a brute force approach. Faster and more accurate algorithms to extract skeletons from areas exist but are not yet implemented. In the meantime, skeletons and center lines can be simplified with the Douglas-Peucker algorithm: v.generalize method=douglas.
EXAMPLE
Voronoi diagram for points
This example uses the hospitals in the North Carolina dataset.
g.region -p raster=elev_state_500m
v.voronoi input=hospitals output=hospitals_voronoi
Result:
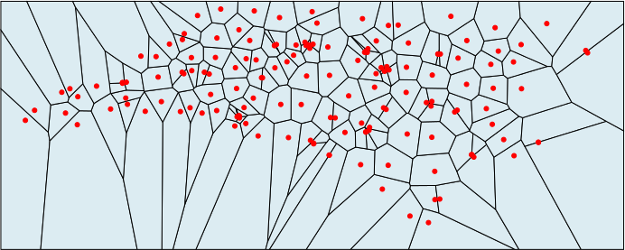
Voronoi diagram for hospitals in North Carolina
Voronoi diagram for areas
This example uses urban areas in the North Carolina dataset.
g.region -p n=162500 s=80000 w=727000 e=846000 res=500
v.voronoi input=urbanarea output=urbanarea_voronoi -a
Result:
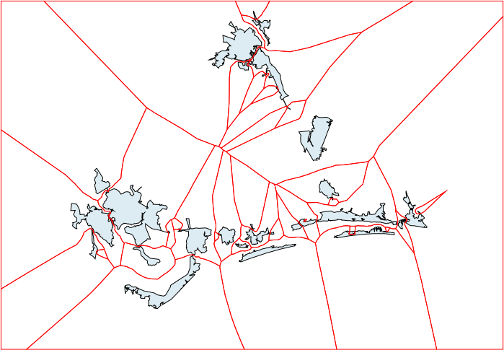
Voronoi diagram for urban areas in North Carolina
Skeletons and center lines of areas
This example uses urban areas in the North Carolina dataset.
g.region -p n=161000 s=135500 w=768500 e=805500 res=500
v.voronoi input=urbanarea output=urbanarea_centerline -s
v.voronoi input=urbanarea output=urbanarea_skeleton -s thin=2000
Result:
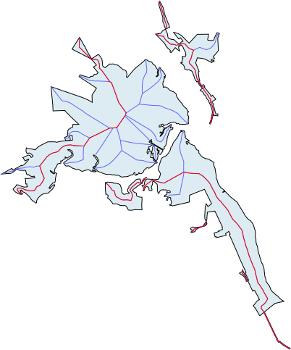
Skeleton (blue) and center line (red) for urban areas in North Carolina
REFERENCES
Steve J. Fortune, (1987). A Sweepline Algorithm for Voronoi Diagrams, Algorithmica 2, 153-174 (DOI).
SEE ALSO
AUTHORS
James Darrell McCauley, Purdue University
GRASS 5 update, improvements: Andrea Aime,
Modena, Italy
GRASS 5.7 update: Radim Blazek
Markus Metz
SOURCE CODE
Available at: v.voronoi source code
(history)
Latest change: Sunday Jun 07 22:14:53 2026 in commit 0f6f0a5