r.niche.similarity
Computes niche overlap or similarity
r.niche.similarity [-idcm] maps=name [,name,...] [output=name] [nprocs=integer] [--overwrite] [--verbose] [--quiet] [--qq] [--ui]
Example:
r.niche.similarity maps=name
grass.tools.Tools.r_niche_similarity(maps, output=None, nprocs=0, flags=None, overwrite=None, verbose=None, quiet=None, superquiet=None)
Example:
tools = Tools()
tools.r_niche_similarity(maps="name")
This grass.tools API is experimental in version 8.5 and expected to be stable in version 8.6.
grass.script.run_command("r.niche.similarity", maps, output=None, nprocs=0, flags=None, overwrite=None, verbose=None, quiet=None, superquiet=None)
Example:
gs.run_command("r.niche.similarity", maps="name")
Parameters
maps=name [,name,...] [required]
Input maps
output=name
Name of output text file
nprocs=integer
Number of threads for parallel computing
0: use OpenMP default; >0: use nprocs; <0: use MAX-nprocs
Default: 0
-i
I niche similarity
-d
D niche similarity
-c
Correlation
-m
remove NA cells
--overwrite
Allow output files to overwrite existing files
--help
Print usage summary
--verbose
Verbose module output
--quiet
Quiet module output
--qq
Very quiet module output
--ui
Force launching GUI dialog
maps : str | list[str], required
Input maps
Used as: input, raster, name
output : str, optional
Name of output text file
Used as: output, file, name
nprocs : int, optional
Number of threads for parallel computing
0: use OpenMP default; >0: use nprocs; <0: use MAX-nprocs
Default: 0
flags : str, optional
Allowed values: i, d, c, m
i
I niche similarity
d
D niche similarity
c
Correlation
m
remove NA cells
overwrite : bool, optional
Allow output files to overwrite existing files
Default: None
verbose : bool, optional
Verbose module output
Default: None
quiet : bool, optional
Quiet module output
Default: None
superquiet : bool, optional
Very quiet module output
Default: None
Returns:
result : grass.tools.support.ToolResult | None
If the tool produces text as standard output, a ToolResult object will be returned. Otherwise, None will be returned.
Raises:
grass.tools.ToolError: When the tool ended with an error.
maps : str | list[str], required
Input maps
Used as: input, raster, name
output : str, optional
Name of output text file
Used as: output, file, name
nprocs : int, optional
Number of threads for parallel computing
0: use OpenMP default; >0: use nprocs; <0: use MAX-nprocs
Default: 0
flags : str, optional
Allowed values: i, d, c, m
i
I niche similarity
d
D niche similarity
c
Correlation
m
remove NA cells
overwrite : bool, optional
Allow output files to overwrite existing files
Default: None
verbose : bool, optional
Verbose module output
Default: None
quiet : bool, optional
Quiet module output
Default: None
superquiet : bool, optional
Very quiet module output
Default: None
DESCRIPTION
Module r.niche.similarity computes two metrics to quantify niche similarity or overlap between all pairs of input raster layers.
One is the niche equivalency or similarity for two species following Warren et al. (2008) based on Schoeners D (Schoener, 1968). This metric ranges from 0 to 1, representing respectively no overlap and an identical distribution.
The other is the niche overlap metric which indicates the niche overlap from predictions of species distributions with the I similarity statistic of Warren et al. (2009), which is based on Hellinger Distances (van der Vaart, 1998). The statistic ranges from 0 (no overlap) to 1 (the distributions are identical).
By default the results are written to screen, but they can also be written to a text file with two columns for the names of each pair of rasters, a third column for the type of statistic (D or I) and a fourth column for the D or I statistic.
Notes
This implementation is especially suitable if you are working with very large data sets. Results were checked against the nicheOverlap function in the dismo package for R.
If any of the input maps include NODATA cells, these should normally not be included. To ensure this, the -m flag can be set to remove them. This mimics the default behaviour of the nicheOverlap function in the R dismo package. Depending on what the NODATA represents, an alternative approcah is to replace the NODATA with 0 values before running r.niche.overlap.
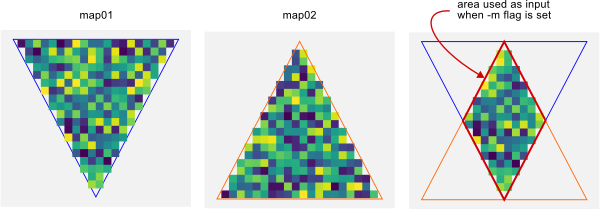
Figure: with the -m flag set, areas with NODATA in any of the input maps are ignored.
EXAMPLE
Create two random rasters
# Set region
g.region rows=18 cols=36 w=10 s=10 res=0.1

# Create rasters r1 and r2
r.mapcalc 'r1 = rand(0.0,1.0)' seed=0
r.mapcalc 'r1 = rand(0.0,1.0)' seed=1
Compute the I and D
# Create rasters r1 and r2
r.niche.similarity -i -d maps=r1,r2
REFERENCES
- Warren, D. L., Glor, R. E., & Turelli, M. 2008. Environmental Niche Equivalency Versus Conservatism: Quantitative Approaches to Niche Evolution. Evolution 62(11): 2868-2883
- Warren, D. L., R. E. Glor, and M. Turelli. 2010. ENMTools: a toolbox for comparative studies of environmental niche models. Ecography 33:607-611.
- Robert J. Hijmans, Steven Phillips, John Leathwick and Jane Elith (2013). Dismo: Species distribution modeling. R package version 0.8-5. http://CRAN.R-project.org/package=dismo
- Christoph Heibl and Clement Calenge (2012). phyloclim: Integrating Phylogenetics and Climatic Niche Modeling. R package version 0.9-0. http://CRAN.R-project.org/package=phyloclim
AUTHOR
Paulo van Breugel, Ecodiv.earth, HAS green academy, Innovative Biomonitoring research group, Climate-robust Landscapes research group
SOURCE CODE
Available at: r.niche.similarity source code
(history)
Latest change: Wednesday Mar 11 08:17:30 2026 in commit 2a14bbb