Note: A new GRASS GIS stable version has been released: GRASS GIS 7.8, available here.
Updated manual page: here
wxGUI Temporal Plot Tool
Table of contents
DESCRIPTION
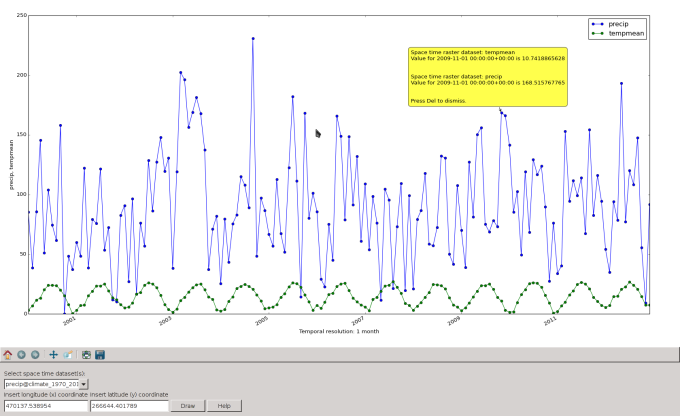
The Temporal Plot Tool is a wxGUI component which allows the user to see in a plot the values of one or more temporal datasets (strds, stvds, str3ds) for a queried point defined by a coordinate pair.Supported features:
- temporal datasets with interval/point and absolute/relative time,
- 2D plots,
- pop-up annotations with values information,
- automatic output to query several point.
NOTES
g.gui.tplot requires the Python plotting library Matplotlib.SEE ALSO
Temporal data processingwxGUI
wxGUI components
AUTHOR
Luca Delucchi, Fondazione Edmund Mach, Italy$Date$
SOURCE CODE
Available at: wxGUI Temporal Plot Tool source code (history)
Note: A new GRASS GIS stable version has been released: GRASS GIS 7.8, available here.
Updated manual page: here
Main index | GUI index | Topics index | Keywords index | Graphical index | Full index
© 2003-2019 GRASS Development Team, GRASS GIS 7.4.5dev Reference Manual