Note: This document is for an older version of GRASS GIS that has been discontinued. You should upgrade, and read the current manual page.

NAME
d.legend - Displays a legend for a 2D or 3D raster map in the active frame of the graphics monitor.KEYWORDS
display, cartography, legendSYNOPSIS
Flags:
- -v
- Do not show category labels
- -c
- Do not show category numbers
- -t
- Draw legend ticks for labels
- -n
- Skip categories with no label
- -s
- Draw smooth gradient
- -f
- Flip legend
- -d
- Add histogram to smoothed legend
- -b
- Show background
- -l
- Use logarithmic scale
- --help
- Print usage summary
- --verbose
- Verbose module output
- --quiet
- Quiet module output
- --ui
- Force launching GUI dialog
Parameters:
- raster=name
- Name of raster map
- raster_3d=name
- Name of 3D raster map
- title=string
- Legend title
- title_fontsize=float
- Title font size
- Default: Same as fontsize
- Options: 1-360
- lines=integer
- Number of text lines (useful for truncating long legends)
- Options: 0-1000
- Default: 0
- thin=integer
- Thinning factor (thin=10 gives cats 0,10,20...)
- Options: 1-1000
- Default: 1
- units=string
- Units to display after labels (e.g. meters)
- labelnum=integer
- Number of text labels for smooth gradient legend
- Options: 2-100
- Default: 5
- label_values=float[,float,...]
- Specific values to draw ticks
- label_step=float
- Display label every step
- digits=integer
- Number of digits after decimal point
- Options: 0-6
- at=bottom,top,left,right
- Size and placement as percentage of screen coordinates (0,0 is lower left)
- bottom,top,left,right
- Options: 0-100
- use=float[,float,...]
- List of discrete category numbers/values for legend
- range=min,max
- Use a subset of the map range for the legend (min,max)
- color=name
- Text color
- Either a standard color name or R:G:B triplet
- Default: black
- font=string
- Font name
- fontsize=float
- Font size
- Default: Auto-scaled
- Options: 1-360
- path=name
- Path to font file
- charset=string
- Text encoding (only applicable to TrueType fonts)
- border_color=name
- Border color
- Either a standard color name, R:G:B triplet, or "none"
- Default: black
- bgcolor=name
- Background color
- Either a standard color name, R:G:B triplet, or "none"
- Default: white
Table of contents
DESCRIPTION
d.legend displays a legend for a user-specified raster map or 3D raster map layer in the active frame on the graphics monitor.The legend's default size is based on the dimensions of the active frame, specifically its height. d.legend will only obscure those portions of the active frame that directly underlie the legend.
NOTES
When using the at to size & place the legend, a user may create a horizontal legend by making the box wider than it is tall.Raster maps based on floating point values will display smoothed, from greatest to smallest value, while categorical raster maps will display in order, from top to bottom. Horizontal legends will always be smoothed. If the box is defined with inverted y-values or an inverted range, the legend will automatically flip. If this is not the desired result, the -f flag may be used to flip it back.
If the user attempts to display a very long legend in a relatively short display frame, the legend may appear in unreadably small text, or even revert to a smooth gradient legend. Use the lines, thin, use, range, and/or -n options to reduce the number of categories to be displayed, or the -s flag to force a smooth gradient legend.
The lines option will display the first number of categories, as defined by value, contained in the raster map. When used with the -n flag, it takes on a new meaning: "up to category #". When used with both thin and the -n flag, its meaning becomes more obscure. When using lines, auto-scaled text similar to "4 of 16 categories" will be placed at the bottom of the legend.
The thin option sets the thinning factor. For raster maps with a 0th category, thin=10 gives cats [0,10,20,...]. For raster maps starting at category 1, thin=10 gives cats [1,11,21,...].
The use option lets the user create a legend made up of arbitrary category values. e.g. use=1000,100,10,0,-10,-100,-1000
The range option lets the user define the minimum and maximum categories to be used in the legend. It may also be used to define the limits of a smooth gradient legend created from a raster containing floating point values. Note the color scale will remain faithful to the category values as defined with r.colors, and the range may be extended to the limits defined by the r.colors color map.
The flag -n is useful for categorial maps, as it suppresses the drawing of non-existing categories (otherwise the full range is shown).
Vertical legends produced with d.legend will place text labels to the right of the legend box, horizontal legends will place text below. This text will be auto-scaled to fit within the frame, reducing the size of the legend if necessary. Legends positioned with the at option will not auto-scale text, in order to provide more control to the user. Smaller text may be obtained in this case by reducing the height of the box or by using the fontsize option. The -c and -v flags may be used to suppress the display of category numbers and labels respectively, or used together to suppress all text of categorial raster maps.
The text produced from floating-point raster maps will automatically create output with a meaningful number of significant digits. For very small values, numbers will be expressed in scientific notation, e.g. "1.7e-9". Option digits can be used to determine how many digits after decimal point will be displayed.
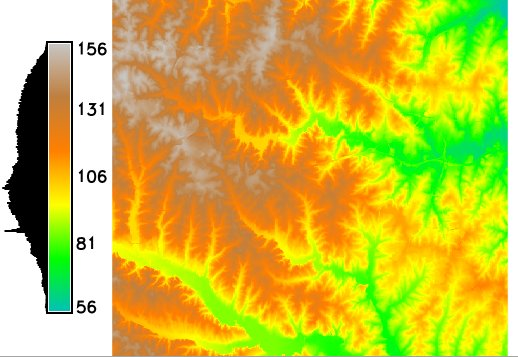
When the -d flag is used to display a histogram distribution along side the smoothed gradient legend, note that the statistics are calculated on the current computational region settings set by g.region. The default range however covers the entire natural bounds of the input map. If the histogram appears empty, check your region settings.
If the raster map's units metadata has been set with the r.support module then it will be displayed along side the legend.
The option title will display the custom title at the top of the legend. In case of vertical legend the title is aligned to the left edge of legend, in case of horizontal legend the title is aligned to the center. title_fontsize can be used to set the size of legend title. By default the legend title font size is the same as labels font size.
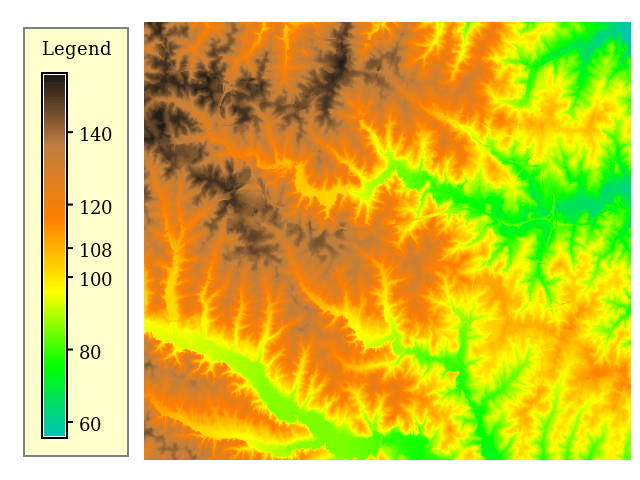
There are different options to customize displayed labels. The labelnum set the number of labels which are displayed in regular intervals. The label_values will specify the values where the labels will be displayed. The label_step will display labels at values which are divisible by this value.
The flag -t will show ticks at labels.
The flag -b will show the background. Options bgcolor and border_color can be used to choose the color of border and background fill.
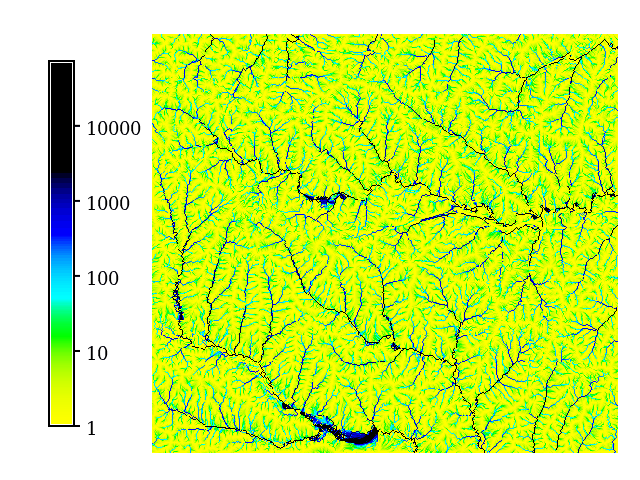
The flag -l will switch to logarithmic scale. In case this flag is used, the provided step in label_step is interpreted in the logarithmic space.
EXAMPLE
Displaying the legend along with a histogram (North Carolina Sample dataset):g.region raster=elevation -p d.rast elevation d.legend -d elevation

g.region raster=elevation -p
d.rast elevation
d.legend raster=elevation -t label_step=20 label_values=108 title=Legend -b bgcolor=255:255:204 border_color=gray

g.region raster=elevation -p
r.watershed -a elevation=elevation threshold=1000 accumulation=flowacc
d.rast flowacc
d.legend raster=flowacc -t -l label_step=1

SEE ALSO
d.barscale, d.colortable, d.font, d.grid, d.rast, d.rast.leg, d.text, d.vect.thematic, r.reclass, r.stats, r3.statsAUTHORS
Bill Brown, U.S. Army Construction Engineering Research LaboratoriesLate 2002: Rewrite of much of the code. Hamish Bowman, Otago University, New Zealand
Additional improvements from various authors
SOURCE CODE
Available at: d.legend source code (history)
Latest change: Tuesday Nov 17 23:30:27 2020 in commit: 1d2e13b93b2db0d918549502f1746e3ba28513ce
Main index | Display index | Topics index | Keywords index | Graphical index | Full index
© 2003-2023 GRASS Development Team, GRASS GIS 7.8.9dev Reference Manual