Note: This document is for an older version of GRASS GIS that has been discontinued. You should upgrade, and read the current manual page.

NAME
r.volume - Calculates the volume of data "clumps".Optionally produces a GRASS vector points map containing the calculated centroids of these clumps.
KEYWORDS
raster, volume, clumpsSYNOPSIS
Flags:
- -f
- Generate unformatted report (items separated by colon)
- --overwrite
- Allow output files to overwrite existing files
- --help
- Print usage summary
- --verbose
- Verbose module output
- --quiet
- Quiet module output
- --ui
- Force launching GUI dialog
Parameters:
- input=name [required]
- Name of input raster map representing data that will be summed within clumps
- clump=name
- Name of input clump raster map
- Preferably the output of r.clump. If no clump map is given than MASK is used.
- centroids=name
- Name for output vector points map to contain clump centroids
- output=name
- Name for output file to hold the report
- If no output file given report is printed to standard output
Table of contents
DESCRIPTION
r.volume is a tool for summing cell values within clumps and calculating volumes and centroids of patches or clumps.r.volume generates a table containing the sum of all cells from a input raster map sorted by category on a clump raster map, and optionally generates a vector points map of the centroids for each clump. If a clump map is not specified, the current MASK is used. The MASK can be defined by r.mask. The sum is multiplied by the area of a cell to give the volume occupied by that cell. See below for an example of the output table.
NOTES
If a clump map is not given and a MASK not set, the program exits with an error message.
r.volume works in the current region and respects the current MASK.
CENTROIDS
The centroid coordinates are the same as those stored in the vector map (if one was requested by centroids parameter). They are guaranteed to fall on a cell of the appropriate category, thus they are not always the true, mathematical centroid. They will always fall at a cell center.Attribute table linked to the vector map with centroids contains several columns:
- cat - category value (integer)
- volume - volume value (double precision)
- average - average value in the clump (double precision)
- sum - sum of cell values in the clump (double precision)
- count - number of cells with the category (integer)
Vector points can be converted directly to a raster map with each point a separate category using v.to.rast.
APPLICATIONS
By preprocessing the elevation raster map with r.mapcalc and using suitable masking or clump maps, very interesting applications can be done with r.volume. Such as, calculating the volume of rock in a potential quarry; calculating cut/fill volumes for roads; finding water volumes in potential reservoirs.EXAMPLE
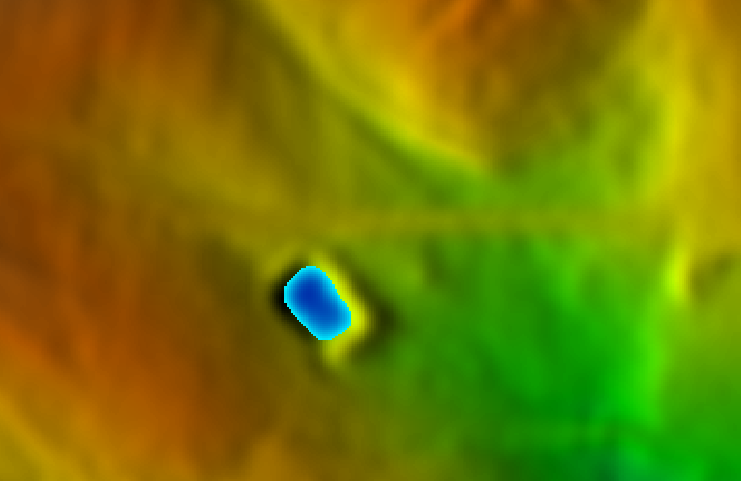
Computation of a water basin volume
The example is based on the North Carolina sample dataset:# set computational region to small basin within extent of LiDAR elevation model g.region n=220361 s=220123 w=638527 e=638894 align=elev_lid792_1m -p # generate shared relief map for better terrain visualization r.relief input=elev_lid792_1m output=elev_lid792_1m_shaded d.shade shade=elev_lid792_1m_shaded color=elev_lid792_1m # query terrain height at a position within the basin r.what map=elev_lid792_1m coordinates=638684.0,220210.0 # 638684.0|220210.0||112.2362 # fill the basin with water, approx 1.5m above terrain r.lake elevation=elev_lid792_1m water_level=113.7 lake=mylake coordinates=638684.0,220210.0 # Lake depth from 0.000000 to 1.622047 (specified water level is taken as zero) # Lake area 764.000000 square meters # Lake volume 648.875328 cubic meters # compute water volume r.volume input=elev_lid792_1m clump=mylake # # Category Average Data # Cells Centroid Total # Number in clump Total in clump Easting Northing Volume # ----------------------------------------------------------------------------- # 1 112.66 54188 481 638683.50 220210.50 54188.35 # 2 112.14 6504 58 638679.50 220215.50 6504.14 # ----------------------------------------------------------------------------- # Total Volume = 60692.49
Report of geological data
The following report was generated by the command (North Carolina sample dataset):# set computational region g.region raster=elevation -p # compute volume r.volume input=elevation clump=geology_30m # # Volume report on data from <elevation> using clumps on <geology_30m> raster map # # Category Average Data # Cells Centroid Total # Number in clump Total in clump Easting Northing Volume # ----------------------------------------------------------------------------- # 217 118.93 86288828 725562 635325.00 221535.00 8628882798.63 # 262 108.97 21650560 198684 638935.00 222495.00 2165056037.02 # 270 92.23 63578874 689373 642405.00 221485.00 6357887443.53 # 405 132.96 33732662 253710 631835.00 224095.00 3373266208.59 # 583 139.35 3011288 21609 630205.00 224665.00 301128821.55 # 720 124.30 599618 4824 634075.00 227995.00 59961816.06 # 766 132.43 936791 7074 631425.00 227845.00 93679120.08 # 862 118.31 7302317 61722 630505.00 218885.00 730231746.74 # 910 94.20 4235816 44964 639215.00 216365.00 423581613.11 # 921 135.22 1693985 12528 630755.00 215445.00 169398523.05 # 945 127.24 1145 9 630015.00 215015.00 114512.03 # 946 89.91 365748 4068 639085.00 215255.00 36574833.85 # 948 129.02 112632 873 630185.00 215115.00 11263181.57 # ----------------------------------------------------------------------------- # Total Volume = 22351026655.81
SEE ALSO
r.clump, r.mask, r.mapcalcAUTHORS
Dr. James Hinthorne, Central Washington University GIS Laboratory, December 1988.Updated to GRASS 7 by Martin Landa, Czech Technical University in Prague, Czech Republic
SOURCE CODE
Available at: r.volume source code (history)
Latest change: Thursday Aug 20 22:42:26 2020 in commit: 615e1cfbebff5d426946819a30d93658b2e07d23
Main index | Raster index | Topics index | Keywords index | Graphical index | Full index
© 2003-2023 GRASS Development Team, GRASS GIS 7.8.9dev Reference Manual
