Note: This document is for an older version of GRASS GIS that has been discontinued. You should upgrade, and read the current manual page.
NAME
v.cluster - Performs cluster identification.KEYWORDS
vector, point cloud, cluster, clump, level1SYNOPSIS
Flags:
- -2
- Force 2D clustering
- -b
- Do not build topology
- Advantageous when handling a large number of points
- -t
- Do not create attribute table
- --overwrite
- Allow output files to overwrite existing files
- --help
- Print usage summary
- --verbose
- Verbose module output
- --quiet
- Quiet module output
- --ui
- Force launching GUI dialog
Parameters:
- input=name [required]
- Name of input vector map
- Or data source for direct OGR access
- output=name [required]
- Name for output vector map
- layer=string
- Layer number or name for cluster ids
- Vector features can have category values in different layers. This number determines which layer to use. When used with direct OGR access this is the layer name.
- Default: 2
- distance=float
- Maximum distance to neighbors
- min=integer
- Minimum number of points to create a cluster
- method=string
- Clustering method
- Options: dbscan, dbscan2, density, optics, optics2
- Default: dbscan
Table of contents
DESCRIPTION
v.cluster partitions a point cloud into clusters or clumps.If the minimum number of points is not specified with the min option, the minimum number of points to constitute a cluster is number of dimensions + 1, i.e. 3 for 2D points and 4 for 3D points.
If the maximum distance is not specified with the distance option, the maximum distance is estimated from the observed distances to the neighbors using the upper 99% confidence interval.
v.cluster supports different methods for clustering. The recommended methods are method=dbscan if all clusters should have a density (maximum distance between points) not larger than distance or method=density if clusters should be created separately for each observed density (distance to the farthest neighbor).
dbscan
The Density-Based Spatial Clustering of Applications with Noise is a commonly used clustering algorithm. A new cluster is started for a point with at least min - 1 neighbors within the maximum distance. These neighbors are added to the cluster. The cluster is then expanded as long as at least min - 1 neighbors are within the maximum distance for each point already in the cluster.dbscan2
Similar to dbscan, but here it is sufficient if the resultant cluster consists of at least min points, even if no point in the cluster has at least min - 1 neighbors within distance.density
This method creates clusters according to their point density. The maximum distance is not used. Instead, the points are sorted ascending by the distance to their farthest neighbor (core distance), inspecting min - 1 neighbors. The densest cluster is created first, using as threshold the core distance of the seed point. The cluster is expanded as for DBSCAN, with the difference that each cluster has its own maximum distance. This method can identify clusters with different densities and can create nested clusters.optics
This method is Ordering Points to Identify the Clustering Structure. It is controlled by the number of neighbor points (option min - 1). The core distance of a point is the distance to the farthest neighbor. The reachability of a point q is its distance from a point p (original optics: max(core-distance(p), distance(p, q))). The aim of the optics method is to reduce the reachability of each point. Each unprocessed point is the seed for a new cluster. Its neighbors are added to a queue sorted by smallest reachability if their reachability can be reduced. The points in the queue are processed and their unprocessed neighbors are added to a queue sorted by smallest reachability if their reachability can be reduced.The optics method does not create clusters itself, but produces an ordered list of the points together with their reachability. The output list is ordered according to the order of processing: the first point processed is the first in the list, the last point processed is the last in the list. Clusters can be extracted from this list by identifying valleys in the points' reachability, e.g. by using a threshold value. If a maximum distance is specified, this is used to identify clusters, otherwise each separated network will constitute a cluster.
The OPTICS algorithm uses each yet unprocessed point to start a new cluster. The order of the input points is arbitrary and can thus influence the resultant clusters.
optics2
EXPERIMENTAL This method is similar to OPTICS, minimizing the reachability of each point. Points are reconnected if their reachability can be reduced. Contrary to OPTICS, a cluster's seed is not fixed but changed if possible. Each point is connected to another point until the core of the cluster (seed point) is reached. Effectively, the initial seed is updated in the process. Thus separated networks of points are created, with each network representing a cluster. The maximum distance is not used.NOTES
By default, cluster IDs are stored as category values of the points in layer 2.EXAMPLE
Analysis of random points for areas in areas of the vector urbanarea (North Carolina sample dataset).First generate 1000 random points within the areas the vector urbanarea and within the subregion, then do clustering and visualize the result:
# pick a subregion of the vector urbanarea
g.region -p n=272950 s=188330 w=574720 e=703090 res=10

# create random points in areas
v.random output=random_points npoints=1000 restrict=urbanarea

# identify clusters
v.cluster input=random_points output=clusters_optics method=optics

# set random vector color table for the clusters
v.colors map=clusters_optics layer=2 use=cat color=random

# display in command line
d.mon wx0

# note the second layer and transparent (none) color of the circle border
d.vect map=clusters_optics layer=2 icon=basic/point size=10 color=none
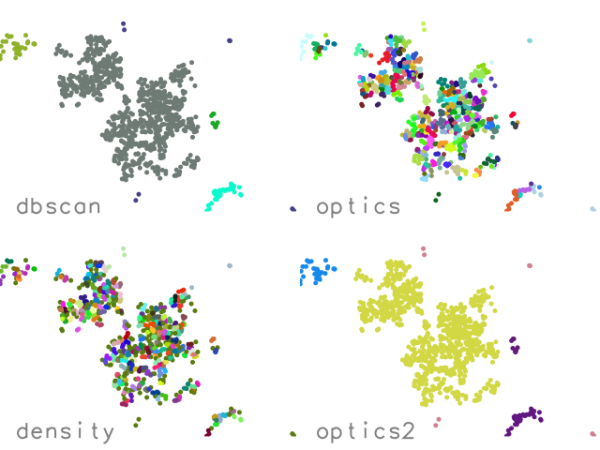
Figure: Four different methods with default settings applied to 1000 random points generated in the same way as in the example.
# pick a subregion of the vector urbanarea
g.region -p n=272950 s=188330 w=574720 e=703090 res=10

# create clustered points
v.random output=rand_clust npoints=100 restrict=urbanarea -a

# identify clusters
v.cluster in=rand_clust out=rand_clusters method=dbscan

# create colors for clusters
v.db.addtable map=rand_clusters layer=2 columns="cat integer,grassrgb varchar(11)"
v.colors map=rand_clusters layer=2 use=cat color=random rgb_column=grassrgb

# display with your preferred method
# remember to use the second layer and RGB column
# for example use
d.vect map=rand_clusters layer=2 color=none rgb_column=grassrgb icon=basic/circle
SEE ALSO
r.clump, v.hull, v.distanceAUTHOR
Markus MetzSOURCE CODE
Available at: v.cluster source code (history)
Latest change: Monday Jul 20 22:24:34 2020 in commit: 5e391c7a07bc6dacdae1a0795be70ab77de06529
Main index | Vector index | Topics index | Keywords index | Graphical index | Full index
© 2003-2023 GRASS Development Team, GRASS GIS 7.8.9dev Reference Manual