Note: This document is for an older version of GRASS GIS that will be discontinued soon. You should upgrade, and read the current manual page.
NAME
i.colors.enhance - Performs auto-balancing of colors for RGB images.KEYWORDS
imagery, RGB, satellite, colorsSYNOPSIS
Flags:
- -f
- Extend colors to full range of data on each channel
- -p
- Preserve relative colors, adjust brightness only
- -r
- Reset to standard color range
- -s
- Process bands serially (default: run in parallel)
- --help
- Print usage summary
- --verbose
- Verbose module output
- --quiet
- Quiet module output
- --ui
- Force launching GUI dialog
Parameters:
- red=name [required]
- Name of red channel
- green=name [required]
- Name of green channel
- blue=name [required]
- Name of blue channel
- strength=float
- Cropping intensity (upper brightness level)
- Options: 0-100
- Default: 98
DESCRIPTION
i.colors.enhance auto-balances and enhances the color channels of a RGB image (e.g. from Landsat) to provide a more natural color mixture. Only the color table of each image band is modified, the base data remains untouched.The module works by calculating a histogram for each color channel and removing an adjustable amount of outliers from either end before recalibrating the color scale with r.colors.
It will work with any 8-bit RGB imagery set and the script is easily modified to work with other datasets of greater band-depth.
NOTES
Depending on the image, it may or may not be advantageous to use the -p flag to preserve the relative color scaling. You will have to experiment with the different options to find a setting that works best for your particular imagery.The strength option should generally be set in the 90-99 range. The lower the number, the more saturated the image becomes. It represents the percentage cut-off for the top end of the color histogram curve. The lower end is fixed at 2% of the area under the curve.
For quicker execution of this module on large images you can achieve largely similar results by switching to a coarser resolution before the running of the module (using g.region) and then back to the original resolution afterwards.
EXAMPLE
North Carolina sample dataset example with Landsat data:g.region raster=lsat7_2002_10 -p d.rgb blue=lsat7_2002_10 green=lsat7_2002_20 red=lsat7_2002_30 d.barscale at=55.3125,93.125 bcolor=white text_pos=over i.colors.enhance blue=lsat7_2002_10 green=lsat7_2002_20 red=lsat7_2002_30 strength=95 d.rgb blue=lsat7_2002_10 green=lsat7_2002_20 red=lsat7_2002_30 d.barscale at=55.3125,93.125 bcolor=white text_pos=over
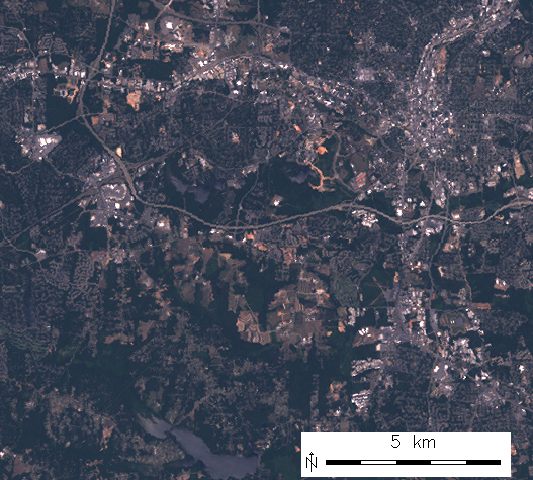
Uncorrected RGB composite of Landsat ETM channels B/G/R
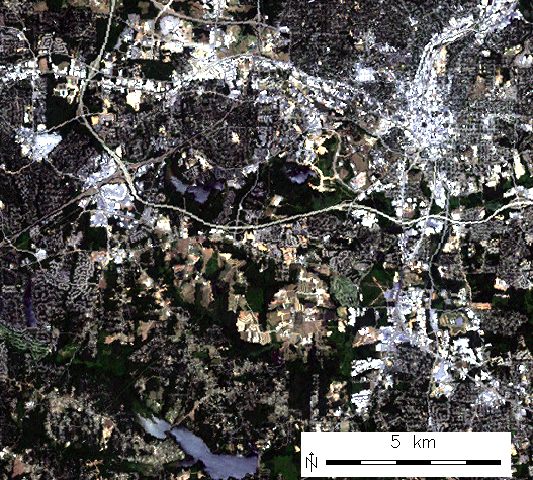
Color corrected RGB composite of Landsat ETM channels B/G/R
TODO
The strength option requires further refinement.SEE ALSO
d.rgb, g.region, i.oif, r.colors, r.composite, r.univarAUTHORS
Markus Neteler, Trento, ItalyM. Hamish Bowman, Dept. Marine Science, Otago University, New Zealand
SOURCE CODE
Available at: i.colors.enhance source code (history)
Latest change: Thursday Feb 03 11:10:06 2022 in commit: 547ff44e6aecfb4c9cbf6a4717fc14e521bec0be
Note: This document is for an older version of GRASS GIS that will be discontinued soon. You should upgrade, and read the current manual page.
Main index | Imagery index | Topics index | Keywords index | Graphical index | Full index
© 2003-2023 GRASS Development Team, GRASS GIS 8.2.2dev Reference Manual