wxGUI Temporal Plot Tool
Table of contents
DESCRIPTION
The Temporal Plot Tool is a wxGUI component that queries and plots the values of a point, defined by a coordinate pair, in one or more temporal datasets (strds, stvds, str3ds).Supported features:
- temporal datasets with interval/point and absolute/relative time,
- show simple linear regression model line with calculated formula
y = a + b*x (y is dependent variable, a is intercept, b is slope, x is explanatory variable)
andr-squared (parameter of goodness-of-fit measure for linear regression model)
- pop-up annotations with values information,
- query and plot multiple points via the command line,
- zoom and pan,
- change labels to x and y axes,
- add title to the plot, and
- export the time series values to a CSV file (x axis data has date time string format,
if you want to use for calculating simple regression model in the
R environment,
LibreOffice
etc., you will obtain a different calculated formula
y = a + b*x
because these software packages use a reference date other than the UNIX Epoch time (00:00:00 UTC on 1 January 1970)).
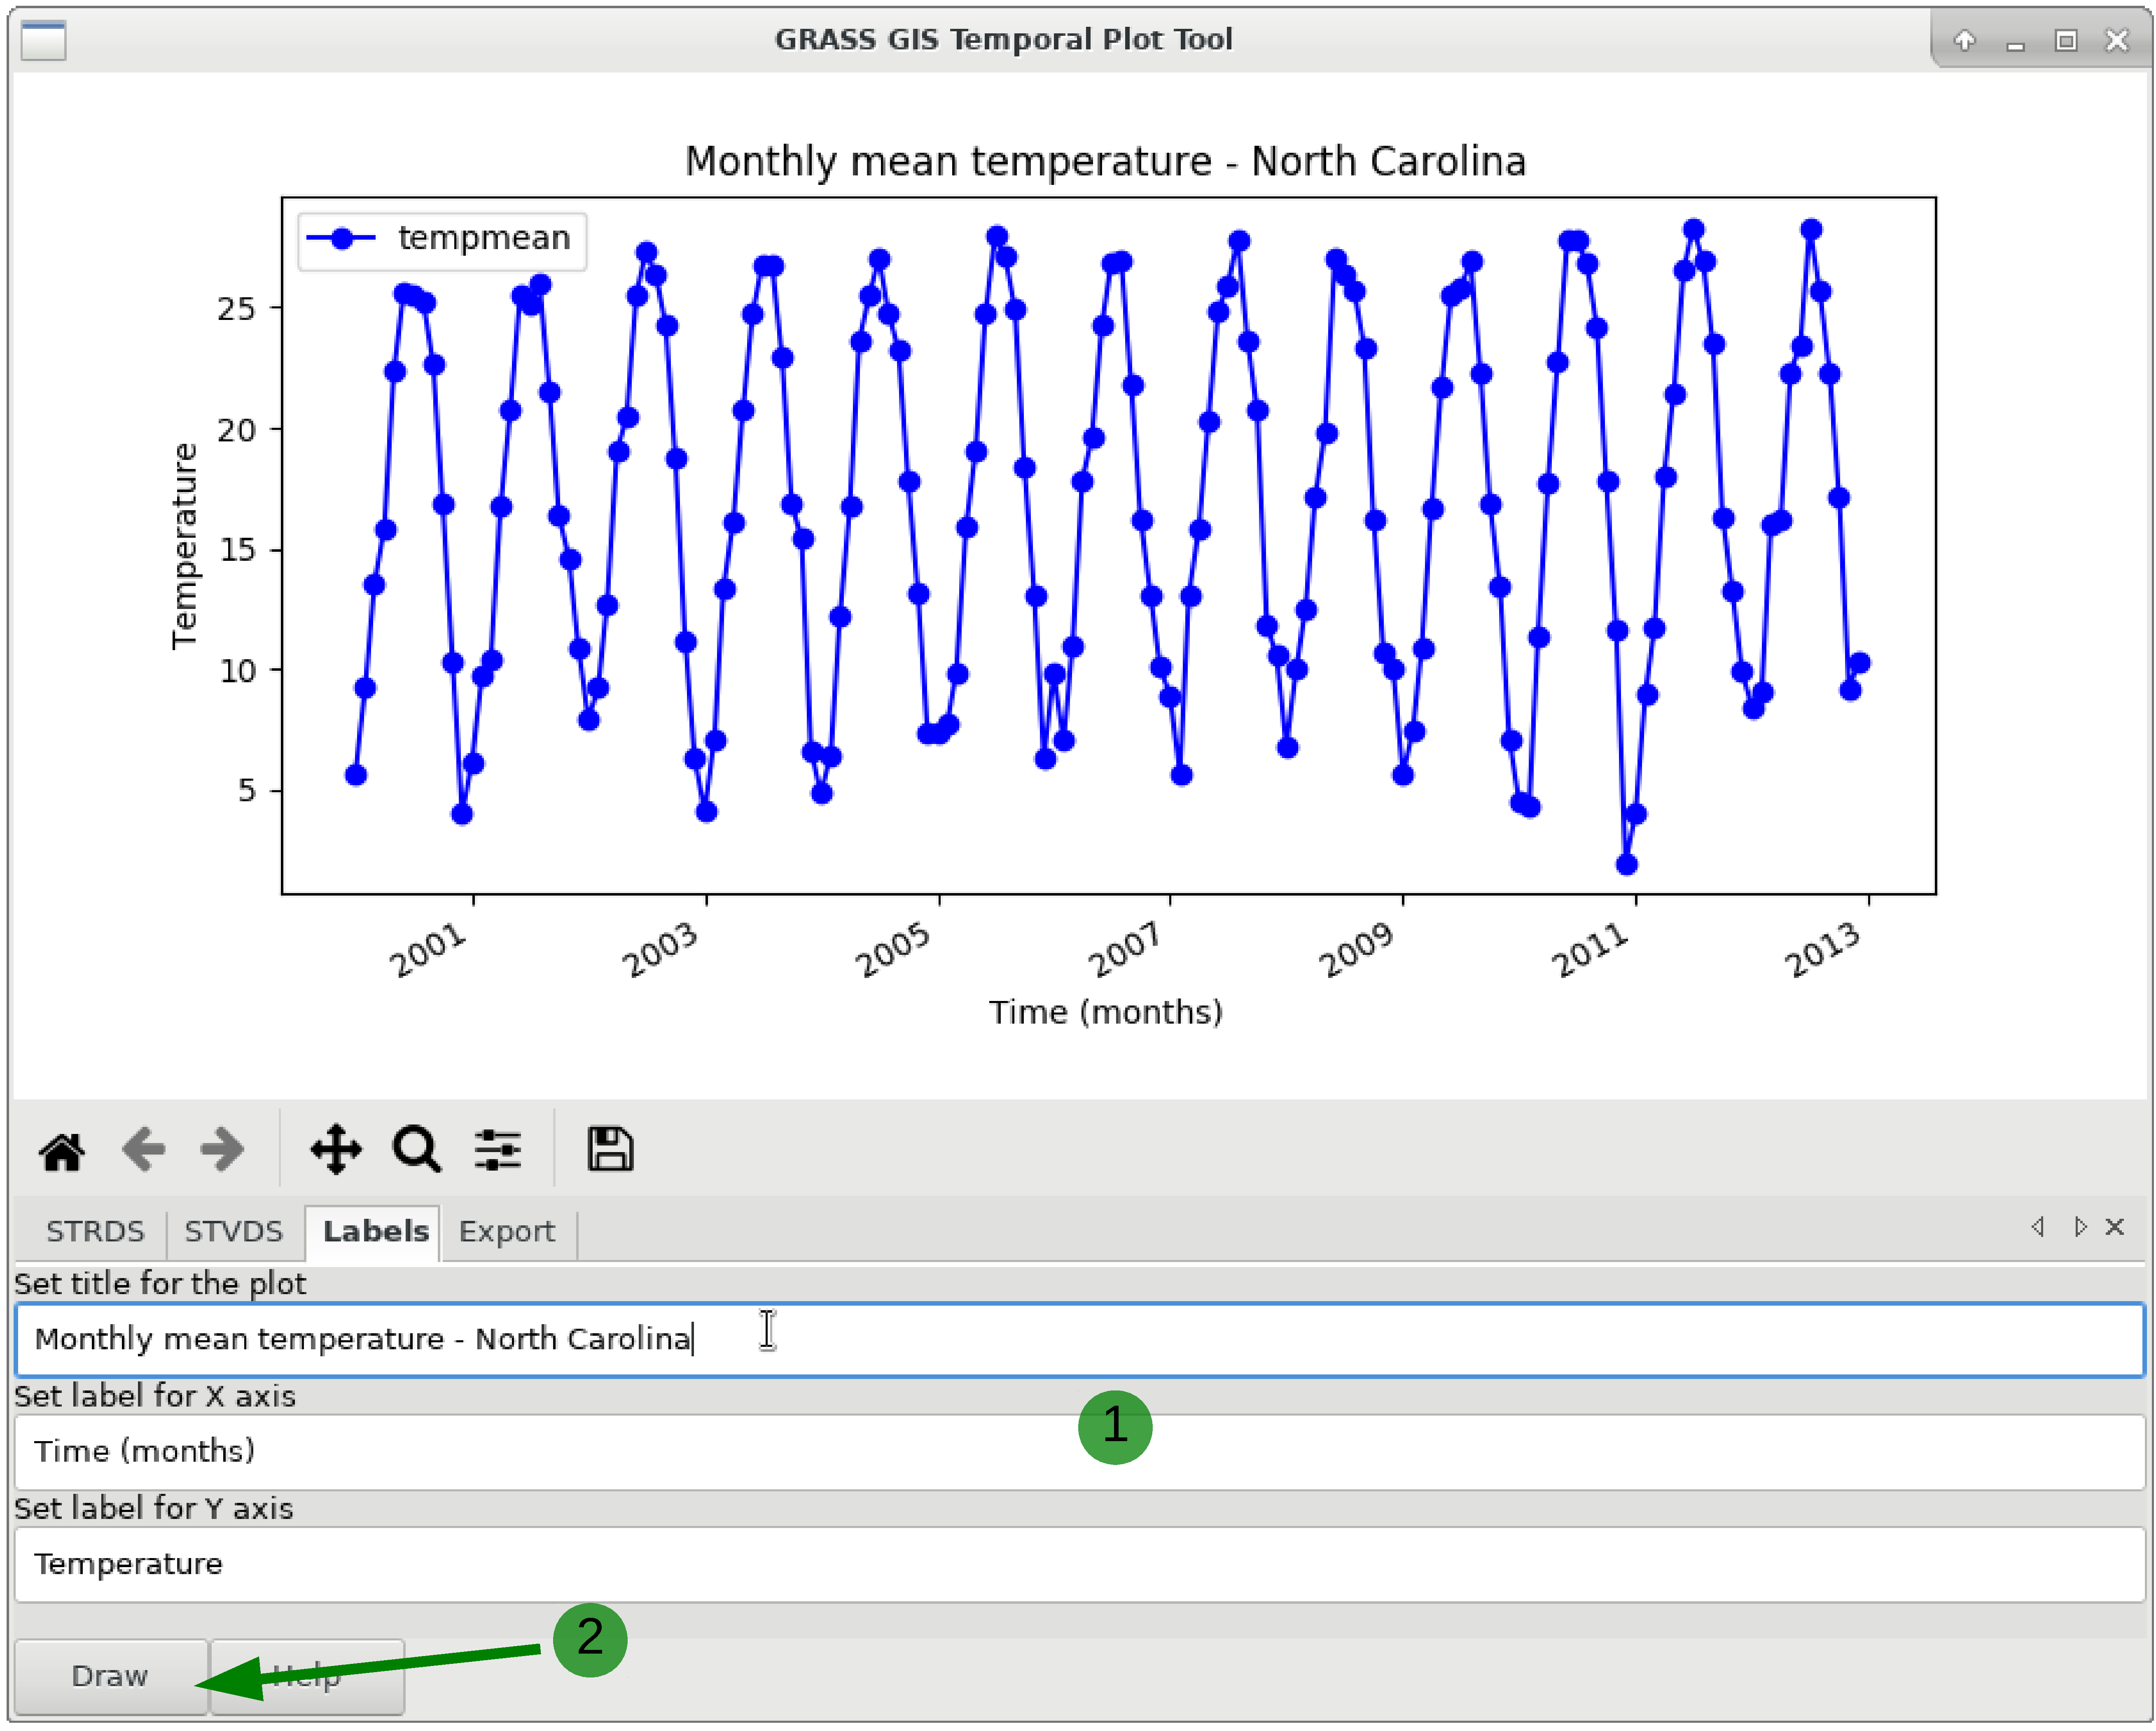
Figure: Temporal Plot Tool
Figure: Add title and labels to a time series plot
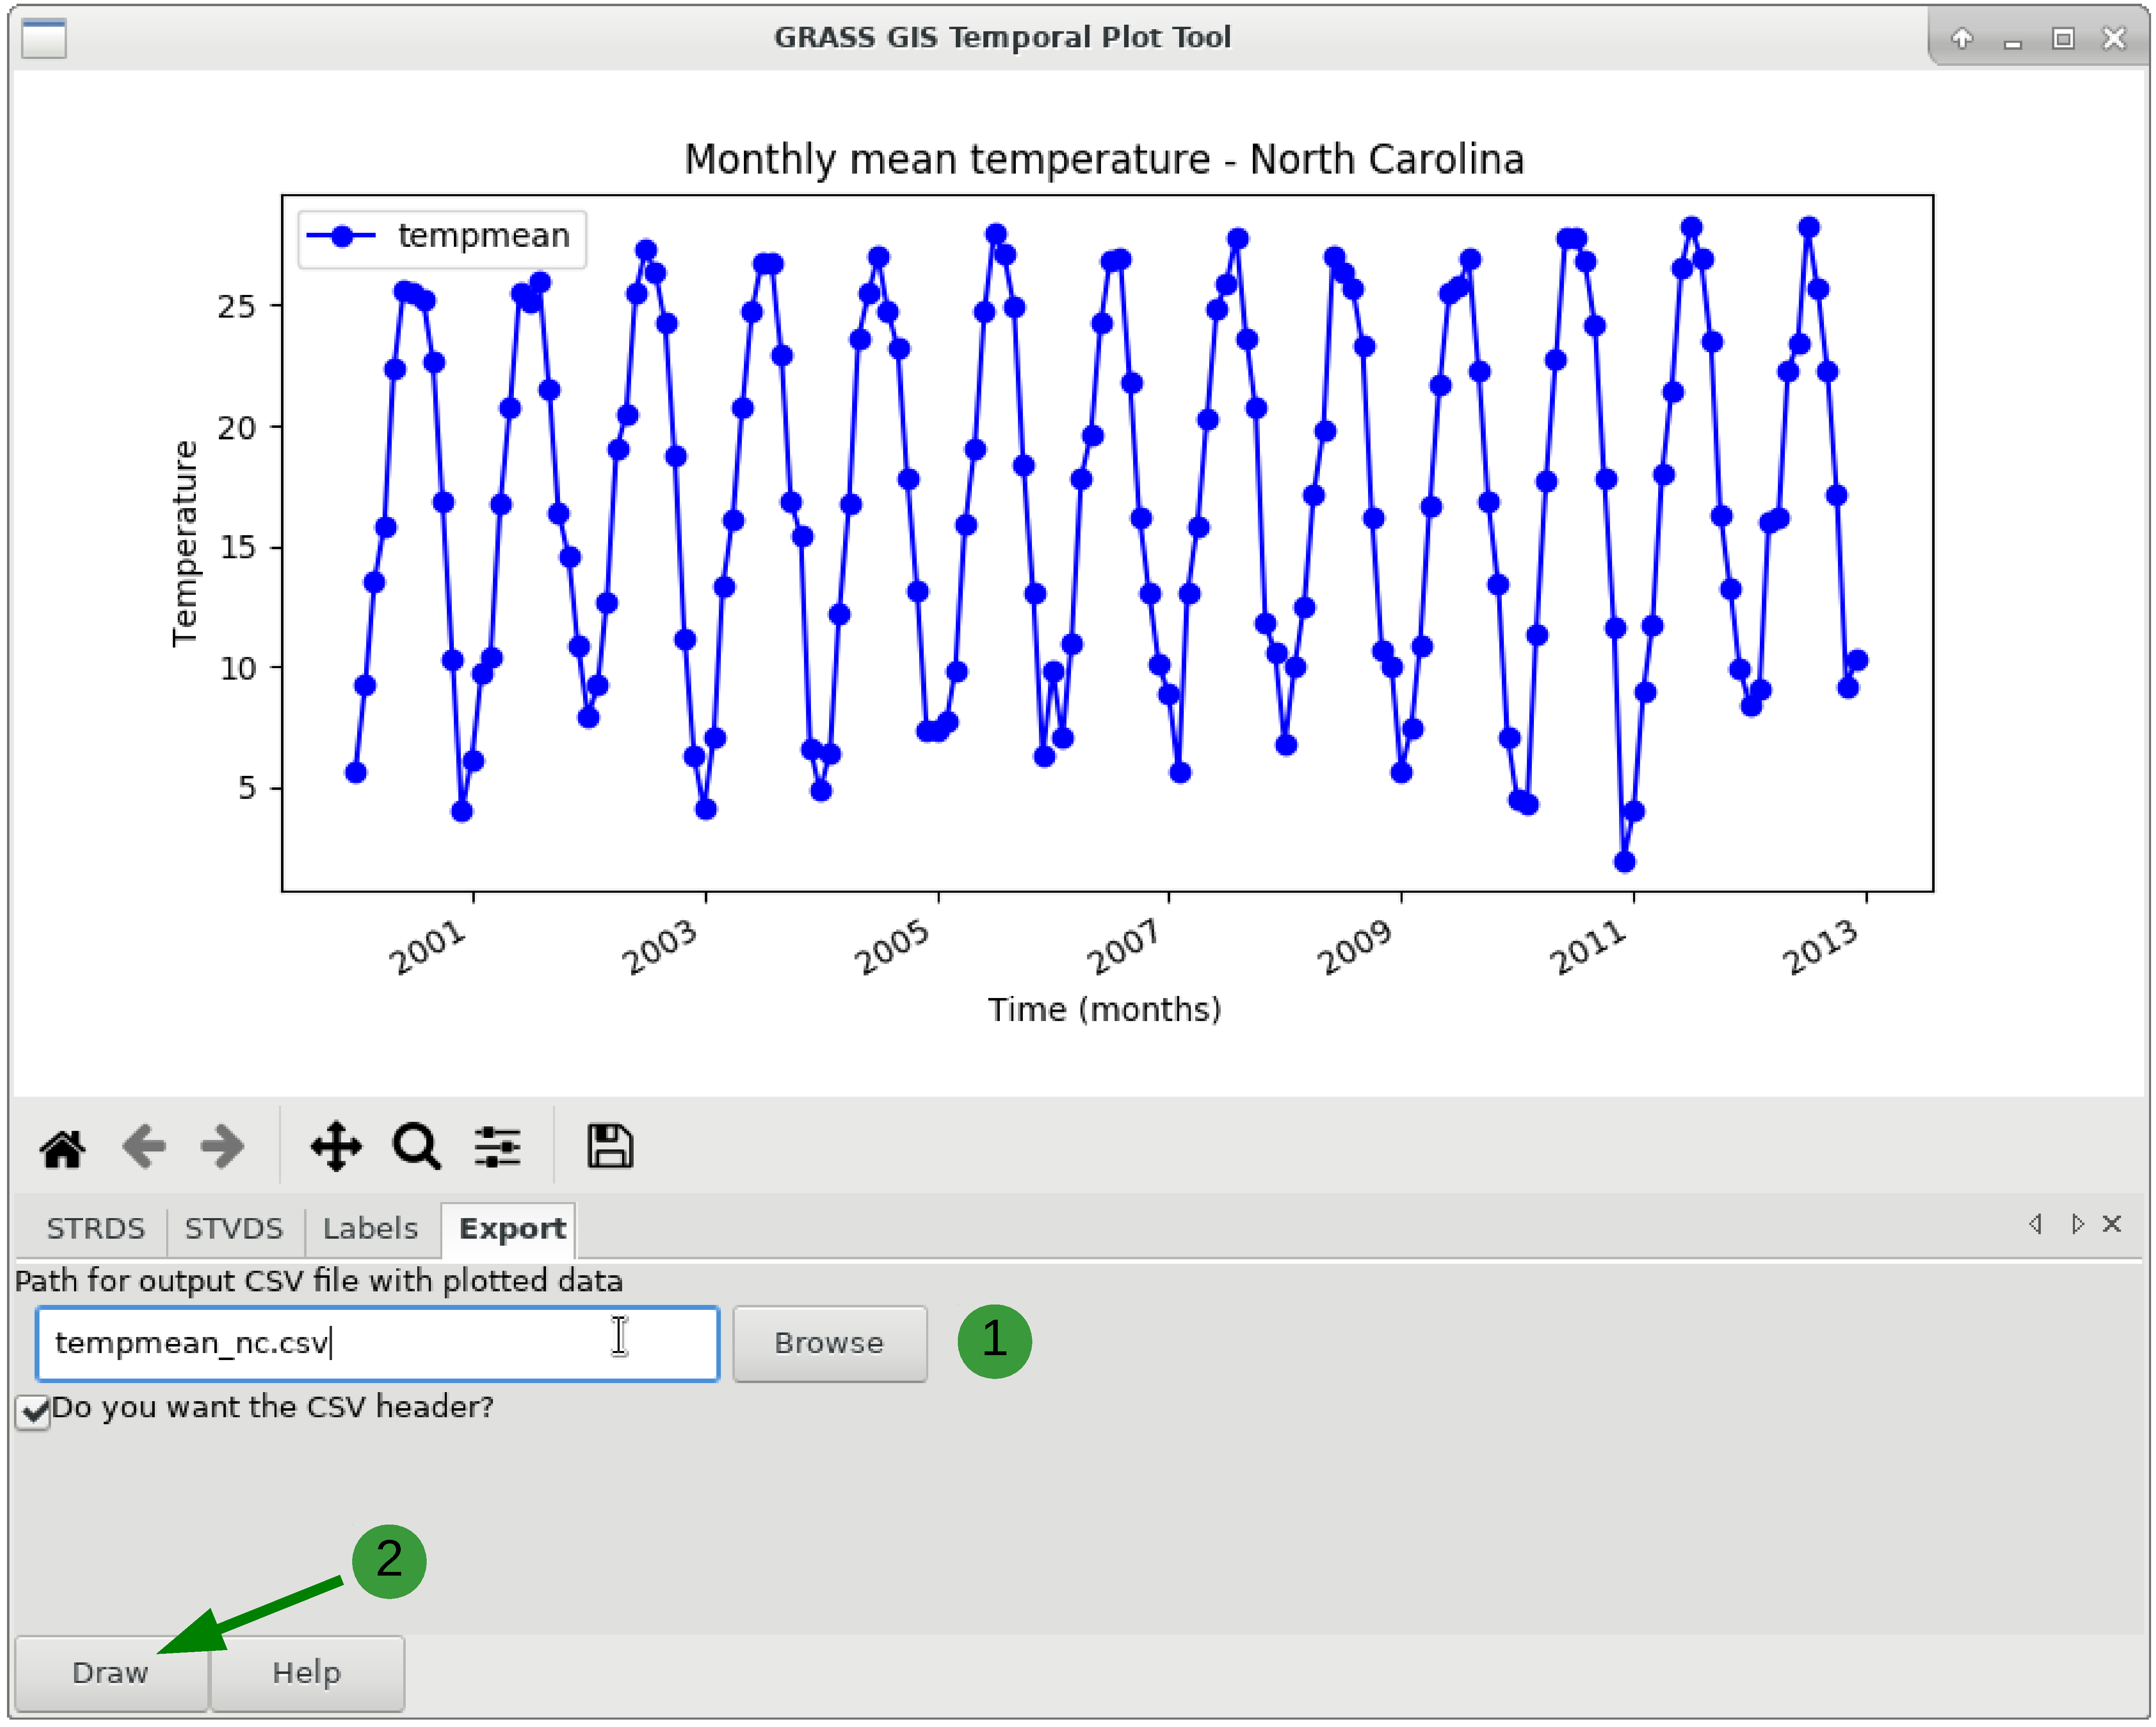
Figure: Export time series values to a text file
NOTES
g.gui.tplot requires the Python plotting library Matplotlib.SEE ALSO
Temporal data processingwxGUI
wxGUI components
AUTHOR
Luca Delucchi, Fondazione Edmund Mach, ItalySOURCE CODE
Available at: wxGUI Temporal Plot Tool source code (history)
Latest change: Saturday Jul 16 18:18:43 2022 in commit: 63e79c72f61149092b9546da4bc343cc581aa180
Note: This document is for an older version of GRASS GIS that will be discontinued soon. You should upgrade, and read the current manual page.
Main index | GUI index | Topics index | Keywords index | Graphical index | Full index
© 2003-2023 GRASS Development Team, GRASS GIS 8.2.2dev Reference Manual