Note: This document is for an older version of GRASS GIS that has been discontinued. You should upgrade, and read the current manual page.

NAME
v.boxplot - Draws a boxplot of values from a specified attribute column in a vector dataset, with an optional grouping based on categories in another column.KEYWORDS
display, vector, plot, histogram, boxplotSYNOPSIS
Flags:
- -h
- horizontal boxplot(s)
- Draw the boxplot horizontal
- -o
- Include outliers
- Draw boxplot(s) with outliers
- -n
- notch
- Draw boxplot(s) with notch
- -r
- Rotate labels
- rotate x-axis labels
- -g
- Add grid lines
- Add grid lines
- --overwrite
- Allow output files to overwrite existing files
- --help
- Print usage summary
- --verbose
- Verbose module output
- --quiet
- Quiet module output
- --ui
- Force launching GUI dialog
Parameters:
- map=name [required]
- Name of vector map
- Or data source for direct OGR access
- layer=string
- Layer number or name
- Vector features can have category values in different layers. This number determines which layer to use. When used with direct OGR access this is the layer name.
- Default: 1
- column=name [required]
- Attribute column value to be plotted
- group_by=name
- Attribute column with categories to group the data by
- where=sql_query
- WHERE conditions of SQL statement without 'where' keyword
- Example: income < 1000 and population >= 10000
- output=name
- Name of output image file
- Name for output file
- plot_dimensions=string
- Plot dimensions (width,height)
- Dimensions (width,height) of the figure in inches
- dpi=integer
- DPI
- resolution of plot
- Default: 100
- fontsize=integer
- Font size
- Default font size
- Default: 10
- order=string
- Sort boxplots
- Sort boxplots based on their median values
- Options: descending, ascending
- axis_limits=string
- Limit value axis [min,max]
- min and max value of y-axis, or x-axis if -h flag is set)
- bx_color=name
- Color of the boxplots
- Color of boxplots
- Default: white
- bx_blcolor=name
- Color of the borders of the boxplots
- Color of the borderlines of the boxplots
- Default: black
- bx_width=float
- Boxplot width
- The width of the boxplots (0,1])
- Options: 0.1-1
- Default: 0.75
- bx_lw=float
- boxplot linewidth
- The boxplots border, whisker and cap line width
- Default: 1
- median_lw=float
- width of the boxplot median line
- Default: 1.1
- median_color=name
- Color of the boxlot median line
- Color of median
- Default: orange
- flier_marker=string
- Flier marker
- Set flier marker (see https://matplotlib.org/stable/api/markers_api.html for options)
- Default: o
- flier_size=string
- Flier size
- Set the flier size
- Default: 2
- flier_color=name
- Flier color
- Set the flier color
- Default: black
DESCRIPTION
The v.boxplot module draws a boxplot of the values in a vector map attribute column. Users can use the where option to select a subset of the attribute table. Values in the column can also be grouped according to the categories in another column (group_by), creating separate boxplots for each group.
Options to customize the appearance of the plot include rotating the plot and x-axis labels, adding notches, removing outliers, and defining the colors of various boxplot components. By default, the resulting plot is displayed on the screen. However, users can save the plot to a file by specifying the desired width, height, and resolution. The format of the saved file is determined by the provided file extension. For example, if plot_output = outputfile.png, the plot will be saved as a PNG file.
EXAMPLE
Example 1
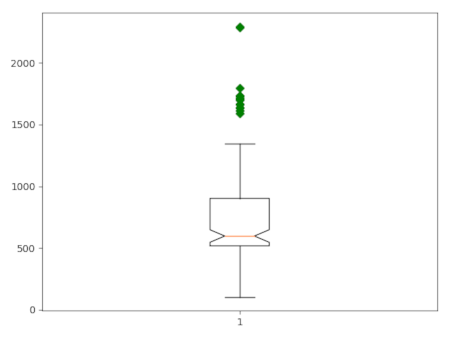
Use the vector layer schools_wake from the NC sample dataset to create boxplots of the core capacity of schools in Wake County, North Carolina. Use the Where clause to exclude all records with no data. Use the -o flag to draw outliers.v.boxplot -n -o map=schools_wake column=CORECAPACI where="CORECAPACI >0"
Example 2
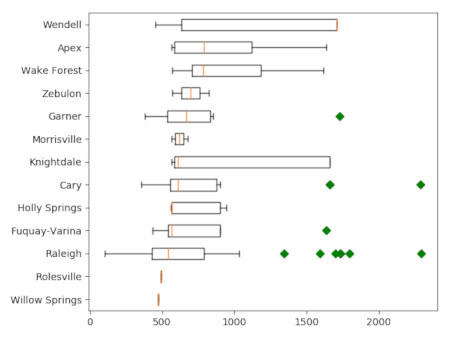
Use the vector layer schools_wake from the NC sample dataset to create boxplots of the core capacity of the schools in Wake County, North Carolina, grouped by city. Use the Where clause to exclude all records with missing data. Use the -o flag to draw outliers.v.boxplot -h -o map=schools_wake column=CORECAPACI where="CORECAPACI >0" group_by=ADDRCITY order=ascending
SEE ALSO
v.scatterplot, d.vect.colhist, r.boxplot, r.series.boxplot, t.rast.boxplot, r.scatterplot r3.scatterplotAUTHOR
Paulo van Breugel, HAS green academy, Innovative Biomonitoring research group, Climate-robust Landscapes research groupSOURCE CODE
Available at: v.boxplot source code (history)
Latest change: Thursday Feb 20 13:02:26 2025 in commit: 53de8196a10ba5a8a9121898ce87861d227137e3
Main index | Vector index | Topics index | Keywords index | Graphical index | Full index
© 2003-2024 GRASS Development Team, GRASS GIS 8.3.3dev Reference Manual

