Note: This document is for an older version of GRASS GIS that has been discontinued. You should upgrade, and read the current manual page.
wxGUI Temporal Plot Tool
Table of contents
DESCRIPTION
The Temporal Plot Tool is a wxGUI component that queries and plots the values of a point, defined by a coordinate pair, in one or more temporal datasets (strds, stvds, str3ds).Supported features:
- temporal datasets with interval/point and absolute/relative time,
- show simple linear regression model line with calculated formula
y = a + b*x (y is dependent variable, a is intercept, b is slope, x is explanatory variable)
andr-squared (parameter of goodness-of-fit measure for linear regression model)
- pop-up annotations with values information,
- query and plot multiple points via the command line,
- zoom and pan,
- change labels to x and y axes,
- add title to the plot, and
- export the time series values to a CSV file (x axis data has date time string format,
if you want to use for calculating simple regression model in the
R environment,
LibreOffice
etc., you will obtain a different calculated formula
y = a + b*x
because these software packages use a reference date other than the UNIX Epoch time (00:00:00 UTC on 1 January 1970)).
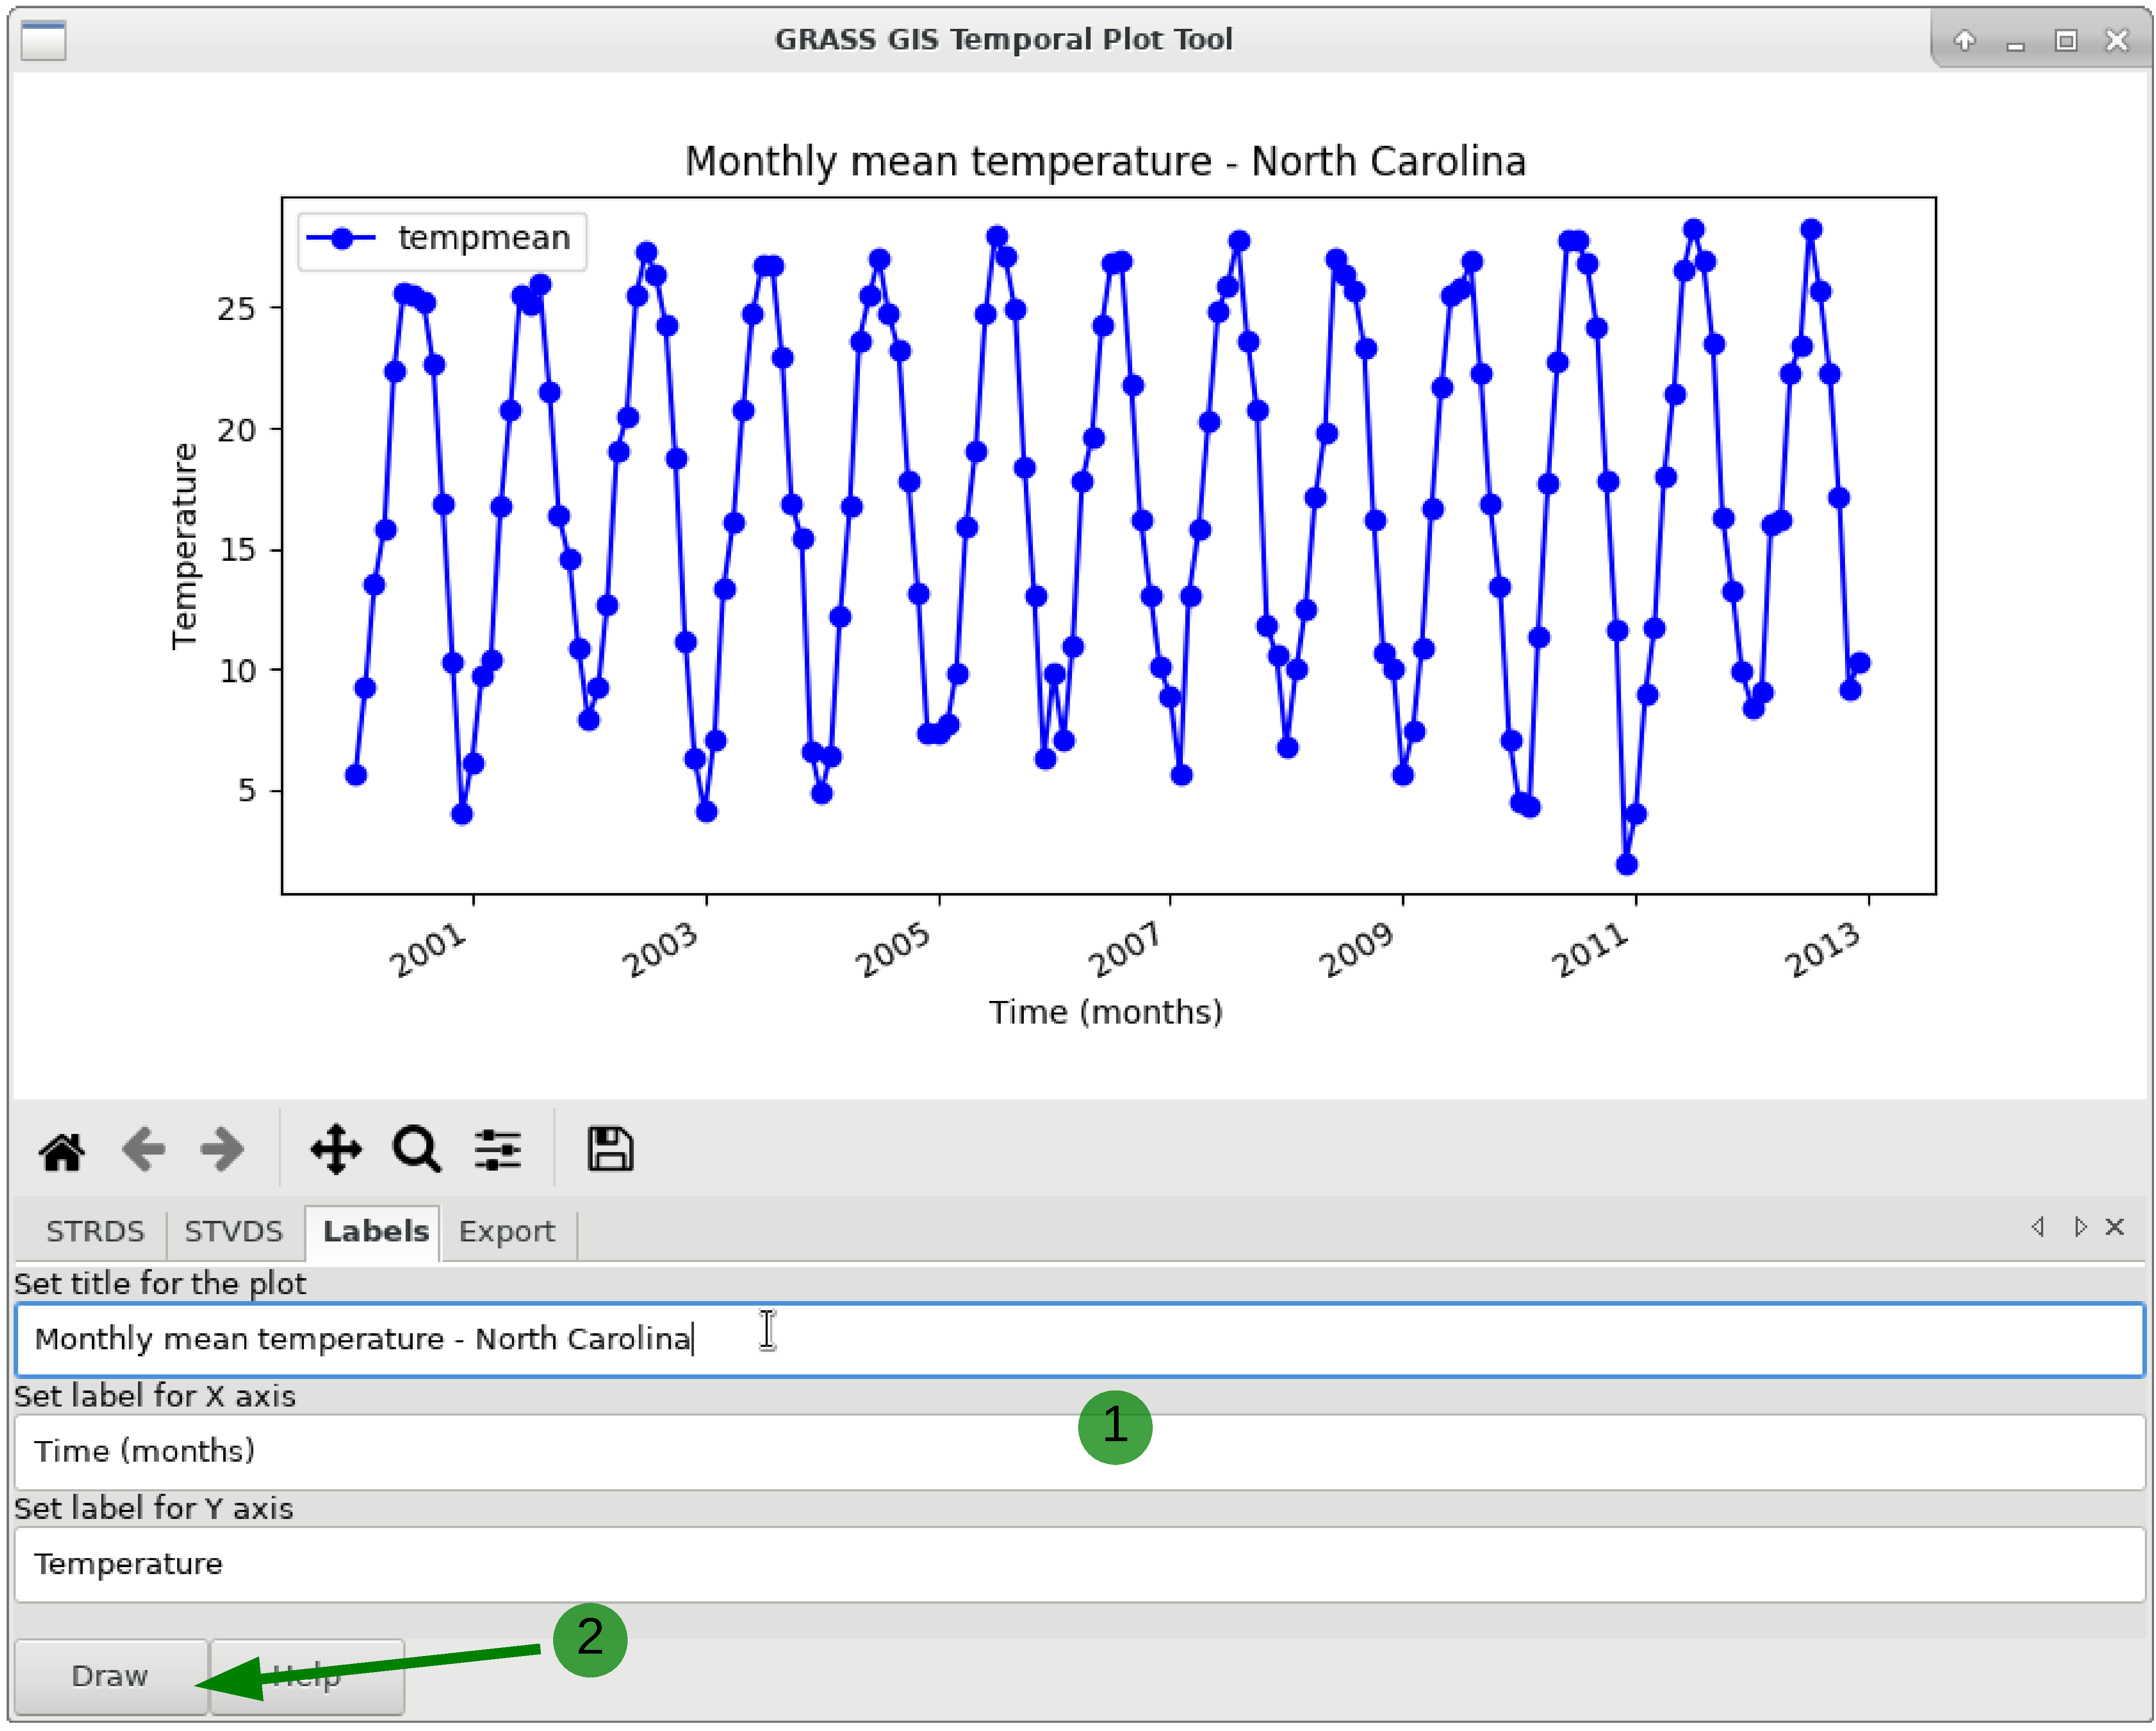
Figure: Temporal Plot Tool
Figure: Add title and labels to a time series plot
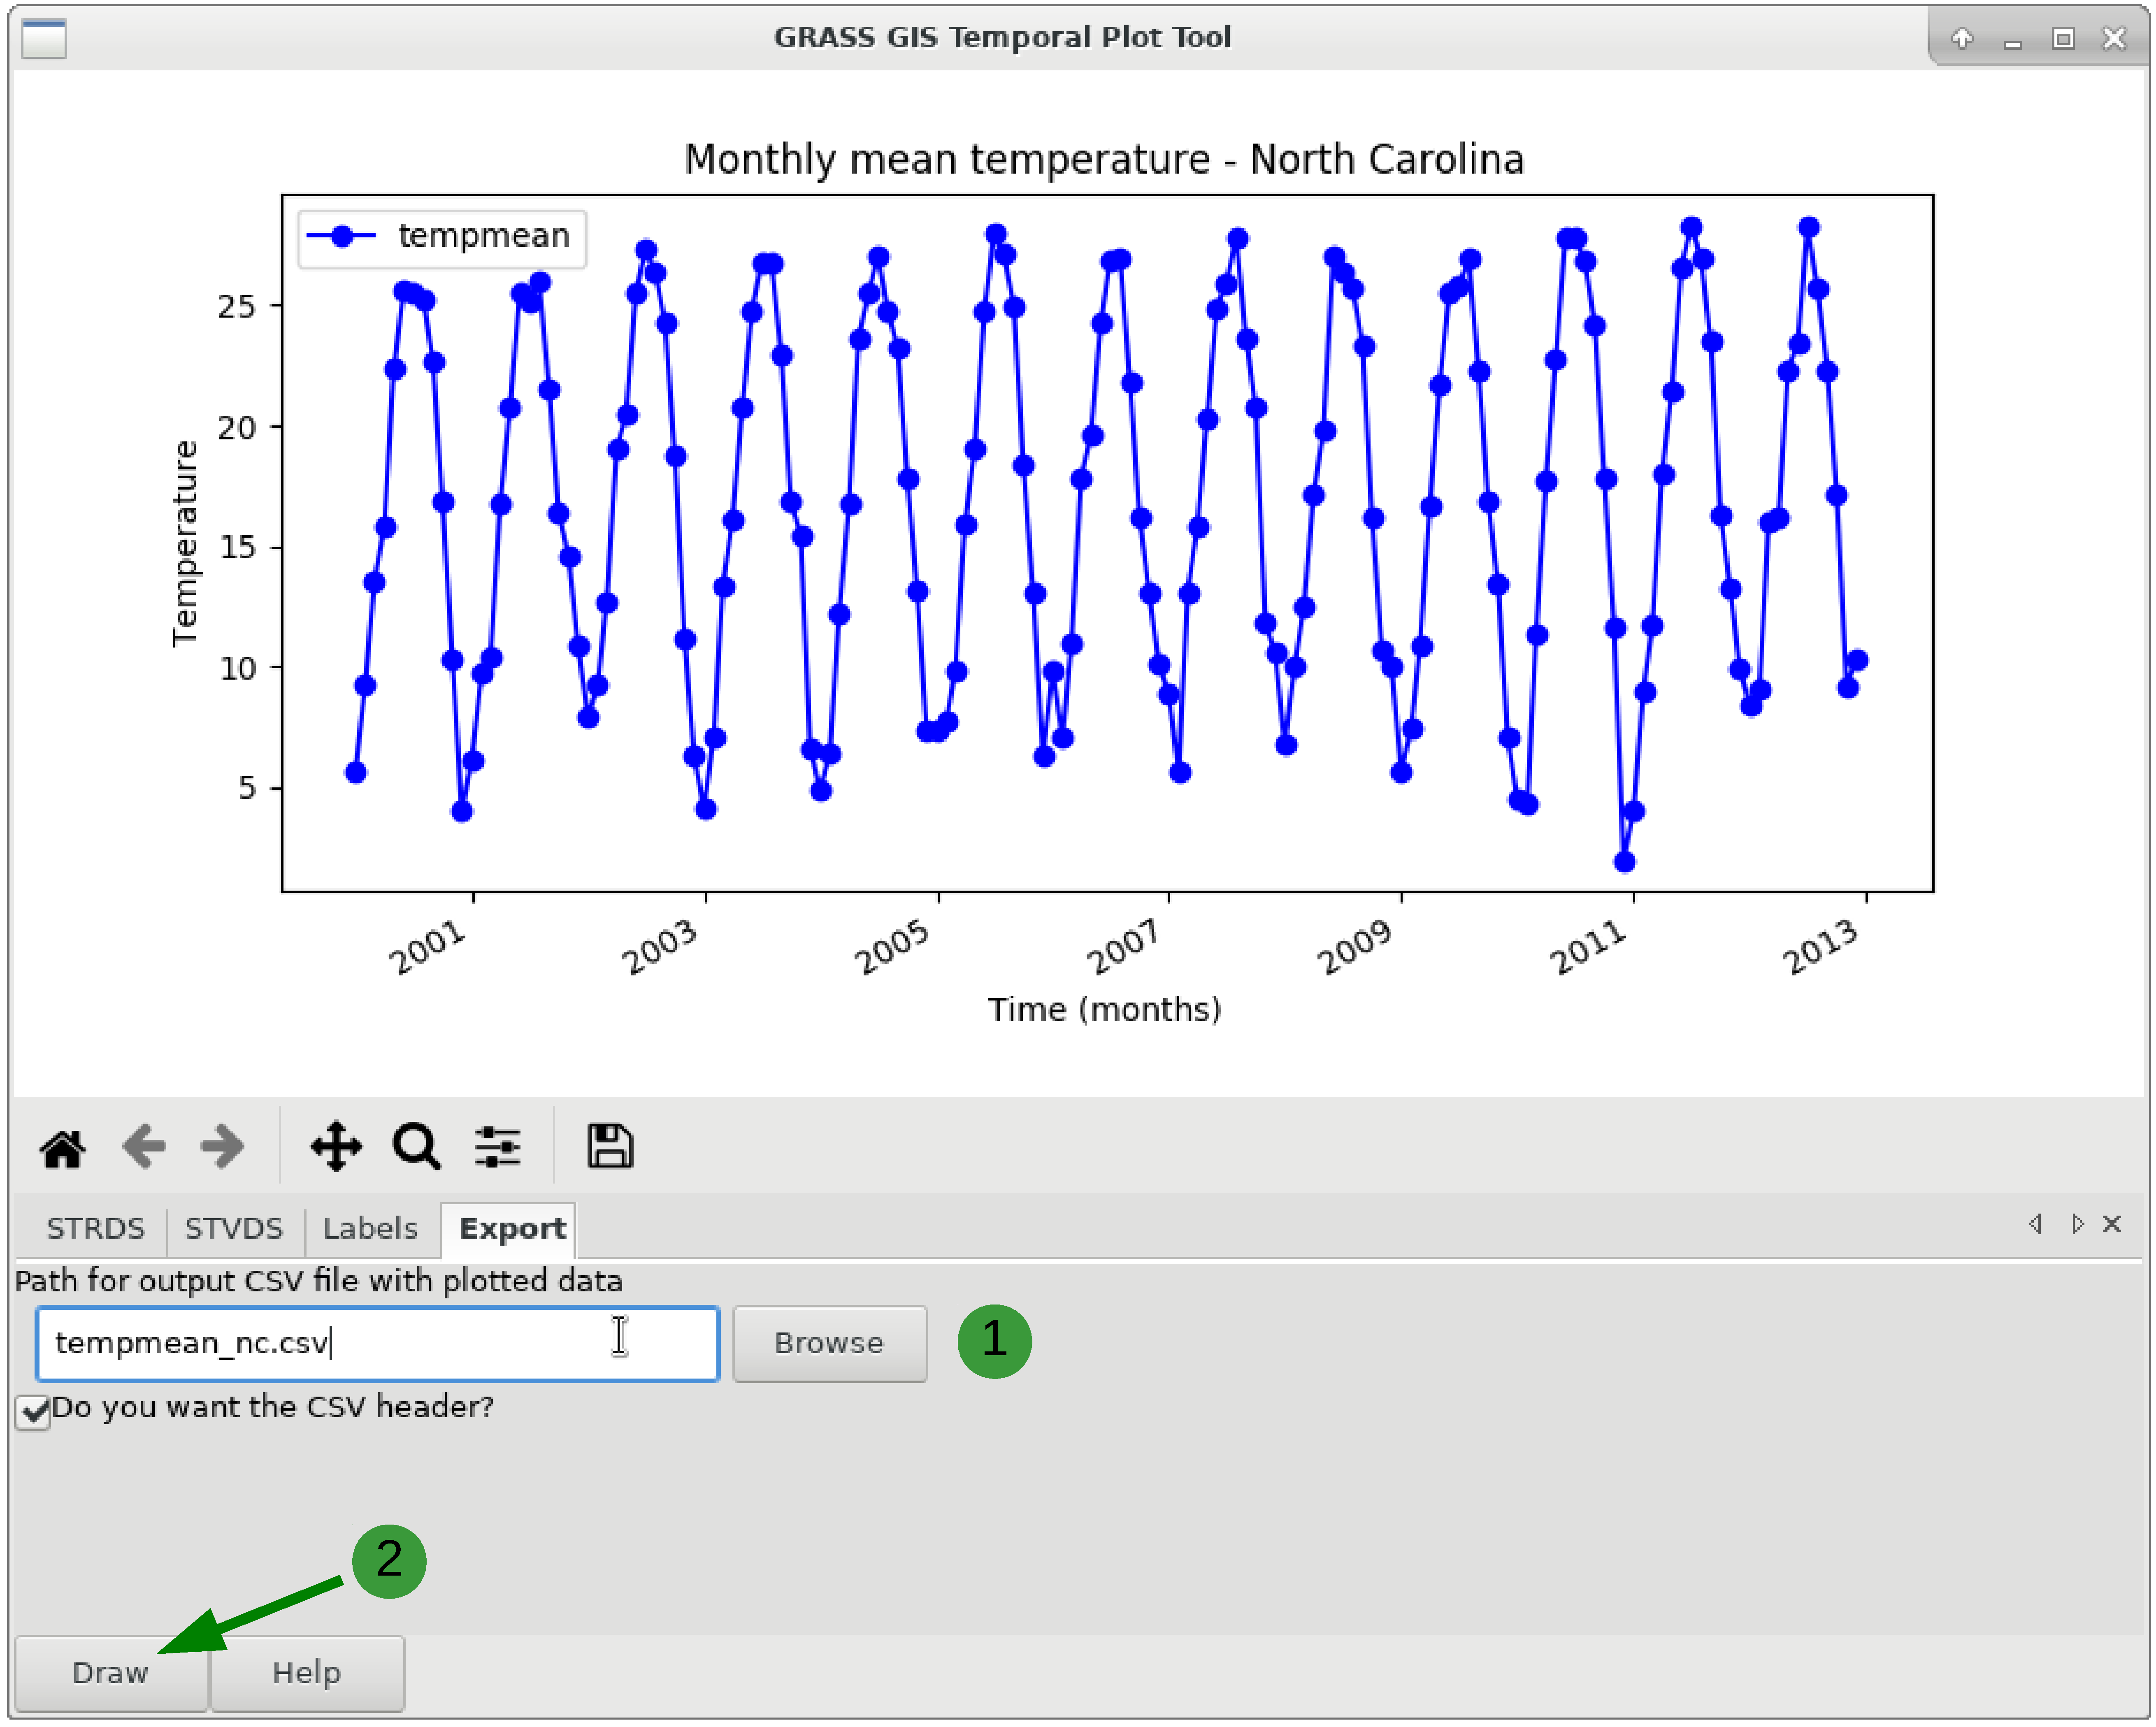
Figure: Export time series values to a text file
NOTES
g.gui.tplot requires the Python plotting library Matplotlib.SEE ALSO
Temporal data processingwxGUI
wxGUI components
AUTHOR
Luca Delucchi, Fondazione Edmund Mach, ItalySOURCE CODE
Available at: wxGUI Temporal Plot Tool source code (history)
Latest change: Monday Feb 27 13:45:25 2023 in commit: a82501dc85294207e8e58437c3ec7f1056465ed4
Main index | GUI index | Topics index | Keywords index | Graphical index | Full index
© 2003-2024 GRASS Development Team, GRASS GIS 8.3.3dev Reference Manual