i.evapo.time
Computes temporal integration of satellite ET actual (ETa) following the daily ET reference (ETo) from meteorological station(s).
i.evapo.time eta=name [,name,...] eta_doy=name [,name,...] eto=name [,name,...] eto_doy_min=float start_period=float end_period=float output=name [--overwrite] [--verbose] [--quiet] [--qq] [--ui]
Example:
i.evapo.time eta=name eta_doy=name eto=name eto_doy_min=0.0 start_period=0.0 end_period=0.0 output=name
grass.tools.Tools.i_evapo_time(eta, eta_doy, eto, eto_doy_min, start_period, end_period, output, overwrite=None, verbose=None, quiet=None, superquiet=None)
Example:
tools = Tools()
tools.i_evapo_time(eta="name", eta_doy="name", eto="name", eto_doy_min=0.0, start_period=0.0, end_period=0.0, output="name")
This grass.tools API is experimental in version 8.5 and expected to be stable in version 8.6.
grass.script.run_command("i.evapo.time", eta, eta_doy, eto, eto_doy_min, start_period, end_period, output, overwrite=None, verbose=None, quiet=None, superquiet=None)
Example:
gs.run_command("i.evapo.time", eta="name", eta_doy="name", eto="name", eto_doy_min=0.0, start_period=0.0, end_period=0.0, output="name")
Parameters
eta=name [,name,...] [required]
Names of satellite ETa raster maps [mm/d or cm/d]
eta_doy=name [,name,...] [required]
Names of satellite ETa Day of Year (DOY) raster maps [0-400] [-]
eto=name [,name,...] [required]
Names of meteorological station ETo raster maps [0-400] [mm/d or cm/d]
eto_doy_min=float [required]
Value of DOY for ETo first day
start_period=float [required]
Value of DOY for the first day of the period studied
end_period=float [required]
Value of DOY for the last day of the period studied
output=name [required]
Name for output raster map
--overwrite
Allow output files to overwrite existing files
--help
Print usage summary
--verbose
Verbose module output
--quiet
Quiet module output
--qq
Very quiet module output
--ui
Force launching GUI dialog
eta : str | list[str], required
Names of satellite ETa raster maps [mm/d or cm/d]
Used as: input, raster, name
eta_doy : str | list[str], required
Names of satellite ETa Day of Year (DOY) raster maps [0-400] [-]
Used as: input, raster, name
eto : str | list[str], required
Names of meteorological station ETo raster maps [0-400] [mm/d or cm/d]
Used as: input, raster, name
eto_doy_min : float, required
Value of DOY for ETo first day
start_period : float, required
Value of DOY for the first day of the period studied
end_period : float, required
Value of DOY for the last day of the period studied
output : str | type(np.ndarray) | type(np.array) | type(gs.array.array), required
Name for output raster map
Used as: output, raster, name
overwrite : bool, optional
Allow output files to overwrite existing files
Default: None
verbose : bool, optional
Verbose module output
Default: None
quiet : bool, optional
Quiet module output
Default: None
superquiet : bool, optional
Very quiet module output
Default: None
Returns:
result : grass.tools.support.ToolResult | np.ndarray | tuple[np.ndarray] | None
If the tool produces text as standard output, a ToolResult object will be returned. Otherwise, None will be returned. If an array type (e.g., np.ndarray) is used for one of the raster outputs, the result will be an array and will have the shape corresponding to the computational region. If an array type is used for more than one raster output, the result will be a tuple of arrays.
Raises:
grass.tools.ToolError: When the tool ended with an error.
eta : str | list[str], required
Names of satellite ETa raster maps [mm/d or cm/d]
Used as: input, raster, name
eta_doy : str | list[str], required
Names of satellite ETa Day of Year (DOY) raster maps [0-400] [-]
Used as: input, raster, name
eto : str | list[str], required
Names of meteorological station ETo raster maps [0-400] [mm/d or cm/d]
Used as: input, raster, name
eto_doy_min : float, required
Value of DOY for ETo first day
start_period : float, required
Value of DOY for the first day of the period studied
end_period : float, required
Value of DOY for the last day of the period studied
output : str, required
Name for output raster map
Used as: output, raster, name
overwrite : bool, optional
Allow output files to overwrite existing files
Default: None
verbose : bool, optional
Verbose module output
Default: None
quiet : bool, optional
Quiet module output
Default: None
superquiet : bool, optional
Very quiet module output
Default: None
DESCRIPTION
i.evapo.time (i.evapo.time_integration) integrates ETa in time following a reference ET (typically) from a set of meteorological stations dataset. Inputs:
- ETa images
- ETa images DOY (Day of Year)
- ETo images
- ETo DOYmin as a single value
Method:
- each ETa pixel is divided by the same day ETo and become ETrF
- each ETrF pixel is multiplied by the ETo sum for the representative days
- Sum all n temporal [ETrF*ETo_sum] pixels to make a summed(ET) in [DOYmin;DOYmax]
representative days calculation: let assume i belongs to range [DOYmin;DOYmax]
DOYbeforeETa[i] = ( DOYofETa[i] - DOYofETa[i-1] ) / 2
DOYafterETa[i] = ( DOYofETa[i+1] - DOYofETa[i] ) / 2
NOTES
ETo images preparation: If you only have one meteorological station data set, the easiest way is:
n=0
for ETo_val in Eto[1] Eto[2] ...
do
    r.mapcalc "eto$n = $ETo_val"
    `expr n = n + 1`
done
with Eto[1], Eto[2], etc being a simple copy and paste from your data file of all ETo values separated by an empty space from each other.
If you have several meteorological stations data, then you need to grid them by generating Thiessen polygons or using different interpolation methods for each day.
For multi-year calculations, just continue incrementing DOY values above 366, it will continue working, up to maximum input of 400 satellite images.
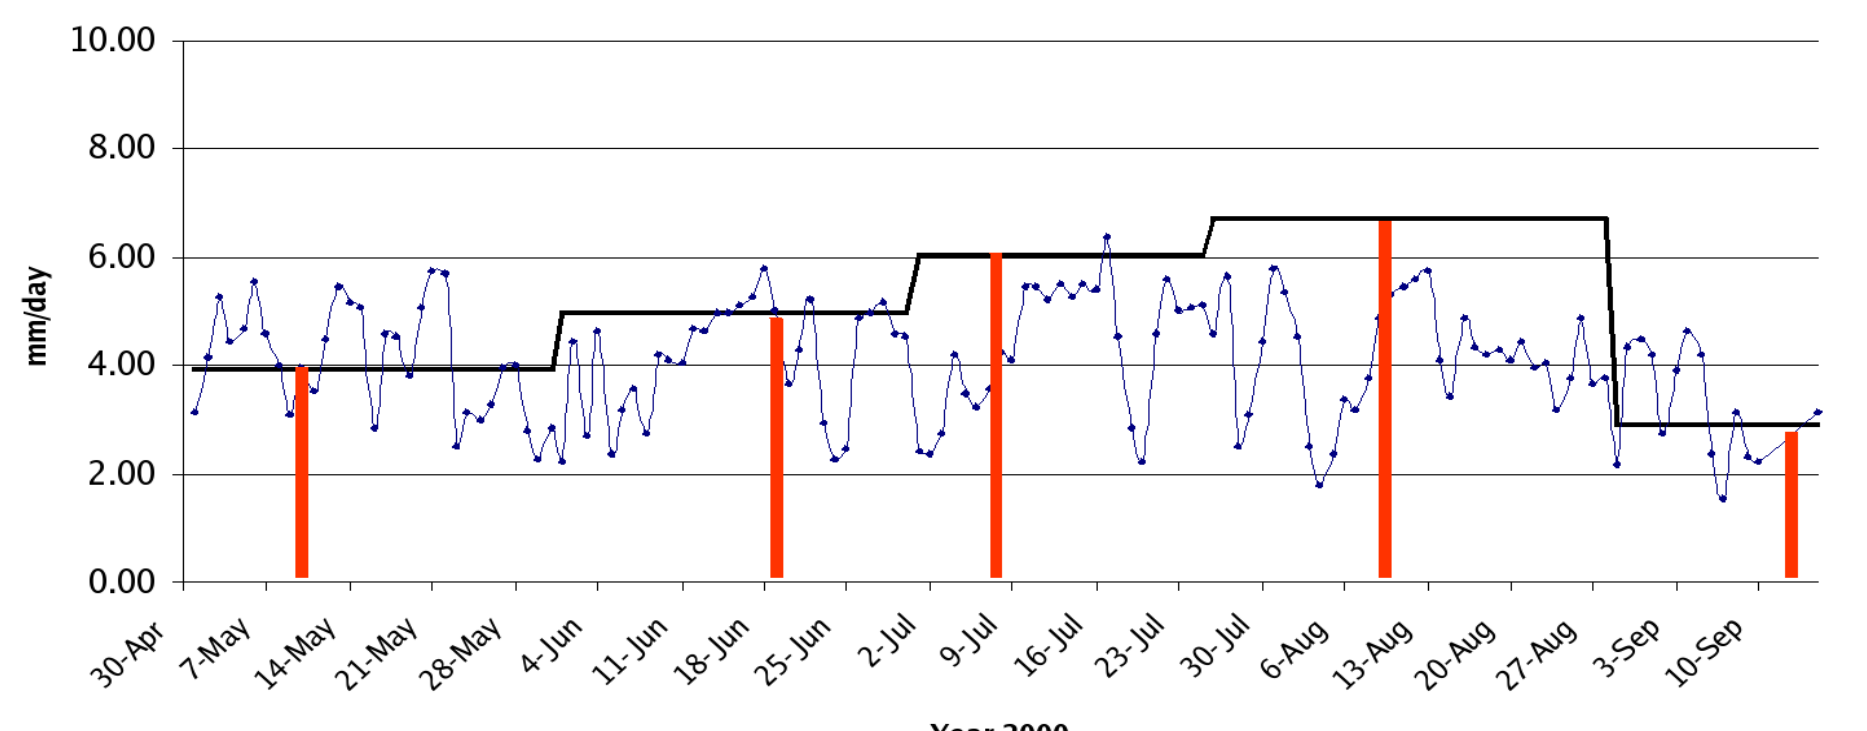
This is an example of a temporal integration from a weather station as
done by Chemin and Alexandridis (2004)
References
Chemin and Alexandridis, 2004. Spatial Resolution Improvement of Seasonal Evapotranspiration for Irrigated Rice, Zhanghe Irrigation District, Hubei Province, China. Asian Journal of Geoinformatics, Vol. 5, No. 1, September 2004 (PDF)
SEE ALSO
i.eb.eta, i.evapo.mh, i.evapo.pt, i.evapo.pm, r.sun
AUTHOR
Yann Chemin, International Rice Research Institute, The Philippines
SOURCE CODE
Available at: i.evapo.time source code
(history)
Latest change: Thursday Jun 26 21:25:27 2025 in commit 3ec2b13