r.surf.gauss
Generates a raster map using gaussian random number generator.
Mean and standard deviation of gaussian deviates can be expressed by the user.
r.surf.gauss output=name [mean=float] [sigma=float] [seed=integer] [--overwrite] [--verbose] [--quiet] [--qq] [--ui]
Example:
r.surf.gauss output=name
grass.tools.Tools.r_surf_gauss(output, mean=0.0, sigma=1.0, seed=None, overwrite=None, verbose=None, quiet=None, superquiet=None)
Example:
tools = Tools()
tools.r_surf_gauss(output="name")
This grass.tools API is experimental in version 8.5 and expected to be stable in version 8.6.
grass.script.run_command("r.surf.gauss", output, mean=0.0, sigma=1.0, seed=None, overwrite=None, verbose=None, quiet=None, superquiet=None)
Example:
gs.run_command("r.surf.gauss", output="name")
Parameters
output=name [required]
Name for output raster map
mean=float
Distribution mean
Default: 0.0
sigma=float
Standard deviation
Default: 1.0
seed=integer
Seed value for the random number generator
Using the same seed ensures identical results, while a randomly generated seed produces different outcomes in each run.
--overwrite
Allow output files to overwrite existing files
--help
Print usage summary
--verbose
Verbose module output
--quiet
Quiet module output
--qq
Very quiet module output
--ui
Force launching GUI dialog
output : str | type(np.ndarray) | type(np.array) | type(gs.array.array), required
Name for output raster map
Used as: output, raster, name
mean : float, optional
Distribution mean
Default: 0.0
sigma : float, optional
Standard deviation
Default: 1.0
seed : int, optional
Seed value for the random number generator
Using the same seed ensures identical results, while a randomly generated seed produces different outcomes in each run.
overwrite : bool, optional
Allow output files to overwrite existing files
Default: None
verbose : bool, optional
Verbose module output
Default: None
quiet : bool, optional
Quiet module output
Default: None
superquiet : bool, optional
Very quiet module output
Default: None
Returns:
result : grass.tools.support.ToolResult | np.ndarray | tuple[np.ndarray] | None
If the tool produces text as standard output, a ToolResult object will be returned. Otherwise, None will be returned. If an array type (e.g., np.ndarray) is used for one of the raster outputs, the result will be an array and will have the shape corresponding to the computational region. If an array type is used for more than one raster output, the result will be a tuple of arrays.
Raises:
grass.tools.ToolError: When the tool ended with an error.
output : str, required
Name for output raster map
Used as: output, raster, name
mean : float, optional
Distribution mean
Default: 0.0
sigma : float, optional
Standard deviation
Default: 1.0
seed : int, optional
Seed value for the random number generator
Using the same seed ensures identical results, while a randomly generated seed produces different outcomes in each run.
overwrite : bool, optional
Allow output files to overwrite existing files
Default: None
verbose : bool, optional
Verbose module output
Default: None
quiet : bool, optional
Quiet module output
Default: None
superquiet : bool, optional
Very quiet module output
Default: None
DESCRIPTION
r.surf.gauss produces a raster map of Gaussian deviates whose mean and standard deviation can be expressed by the user. It uses a Gaussian random number generator. It is essentially the same as r.surf.random, but uses a Gaussian random number generator instead.
EXAMPLE
g.region -p n=228500 s=215000 w=630000 e=645000 res=10
r.surf.gauss out=gauss mean=0 sigma=10

# check result
r.univar gauss
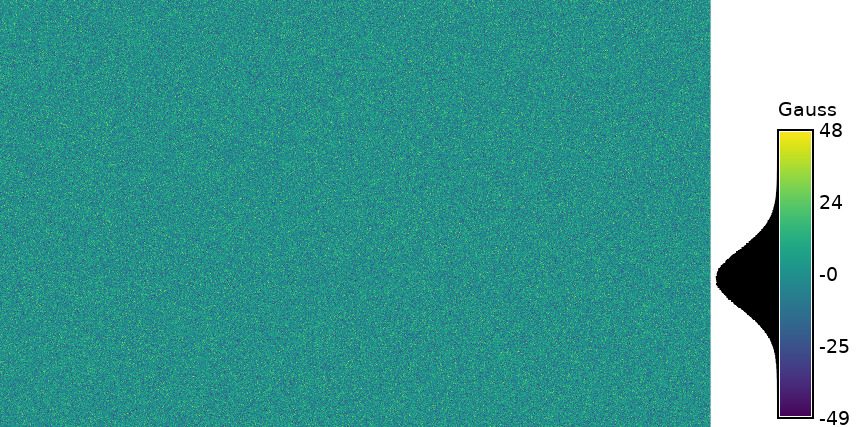
Figure: Random Gaussian surface example (mean: 0; sigma: 10)
With the histogram tool the cell values versus count can be shown.
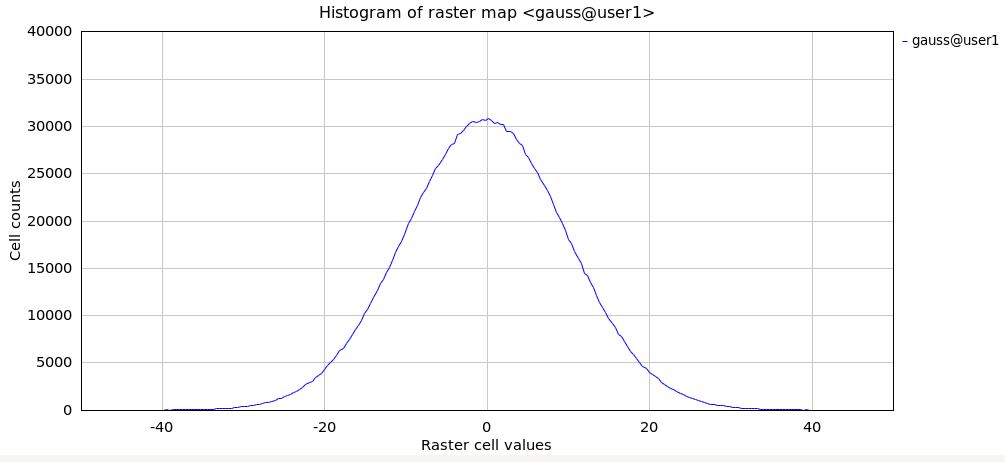
Figure: Histogram of random Gaussian surface example (mean: 0; sigma:
10)
SEE ALSO
r.surf.contour, r.surf.fractal, r.surf.idw, r.surf.random, v.surf.rst
AUTHOR
Jo Wood, ASSIST's home
SOURCE CODE
Available at: r.surf.gauss source code
(history)
Latest change: Thursday Mar 06 19:23:31 2025 in commit 5fd4234