Note: This document is for an older version of GRASS GIS that has been discontinued. You should upgrade, and read the current manual page.
NAME
d.explanation.plot - Draw a plot of multiple rasters to explain a raster operation for example a + b = cKEYWORDS
display, manual, rasterSYNOPSIS
d.explanation.plot
d.explanation.plot --helpd.explanation.plot a=name b=name c=name [label_a=string] [label_b=string] [label_c=string] [--help] [--verbose] [--quiet] [--ui]
Flags:
- --help
- Print usage summary
- --verbose
- Verbose module output
- --quiet
- Quiet module output
- --ui
- Force launching GUI dialog
Parameters:
- a=name [required]
- Name of input raster map
- b=name [required]
- Name of input raster map
- c=name [required]
- Name of input raster map
- label_a=string
- Label above the raster
- label_b=string
- Label above the raster
- label_c=string
- Label above the raster
Table of contents
DESCRIPTION
d.explantion.plot creates a plot of rasters and their relations which can serve as an explanation of a raster operation performed by a module or function.Currently three rasters with preset operators in between them are supported. The rasters are expected to have the following relation:
a + b -> c
EXAMPLES
Complete example using artificial data
r.in.ascii input=- output=input_1 <<EOF
north: 103
south: 100
east: 103
west: 100
rows: 3
cols: 3
5 * 9
* 5 *
* 5 5
EOF
r.in.ascii input=- output=input_2 <<EOF
north: 103
south: 100
east: 103
west: 100
rows: 3
cols: 3
3 4 4
2 2 2
2 1 1
EOF
r.colors map=input_1,input_2 color=viridis
g.region raster=input_1
r.patch input=input_1,input_2 output=result
d.mon wx0 width=400 height=400 output=r_patch.png
d.explanation.plot a=input_1 b=input_2 c=result
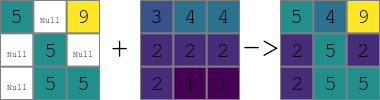
Figure: Resulting image
KNOWN ISSUES
- Issue #3381 prevents d.rast.num to be used with d.mon cairo, so d.mon wx0 needs to be used with this module.
- Issue #3382 prevents usage of centered text with d.mon wx0, so the hardcoded values for text does not work perfectly.
- Issue #3383 prevents d.rast.num to be saved to the image with d.mon wx0, taking screenshot is necessary (with powerful screenshot tool such as Shutter, this also addresses the copping issue below).
- The size of the display must be square to have rasters and their cells as squares, i.e. d.mon wx0 width=400 height=400 must be used. The image needs to be cropped afterwards, e.g. using ImageMagic's mogrify -trim image.png.
SEE ALSO
g.region, d.frame, d.rast.num, d.grid, d.mon, v.mkgridAUTHORS
Vaclav Petras, NCSU GeoForAll LabSOURCE CODE
Available at: d.explanation.plot source code (history)
Latest change: Monday Jun 28 07:54:09 2021 in commit: 1cfc0af029a35a5d6c7dae5ca7204d0eb85dbc55
Main index | Display index | Topics index | Keywords index | Graphical index | Full index
© 2003-2023 GRASS Development Team, GRASS GIS 7.8.9dev Reference Manual