r.runoff
Computes runoff depth, volume and peak discharge for each cell using SCS Curve Number method.
r.runoff rainfall=name [duration=float] curve_number=name [direction=name] [lambda=float] [time_concentration=name] runoff_depth=name [runoff_volume=name] [upstream_area=name] [upstream_runoff_depth=name] [upstream_runoff_volume=name] [time_to_peak=name] [peak_discharge=name] [--overwrite] [--verbose] [--quiet] [--qq] [--ui]
Example:
r.runoff rainfall=name curve_number=name runoff_depth=name
grass.tools.Tools.r_runoff(rainfall, duration=None, curve_number, direction=None, lambda=0.2, time_concentration=None, runoff_depth, runoff_volume=None, upstream_area=None, upstream_runoff_depth=None, upstream_runoff_volume=None, time_to_peak=None, peak_discharge=None, overwrite=None, verbose=None, quiet=None, superquiet=None)
Example:
tools = Tools()
tools.r_runoff(rainfall="name", curve_number="name", runoff_depth="name")
This grass.tools API is experimental in version 8.5 and expected to be stable in version 8.6.
grass.script.run_command("r.runoff", rainfall, duration=None, curve_number, direction=None, lambda=0.2, time_concentration=None, runoff_depth, runoff_volume=None, upstream_area=None, upstream_runoff_depth=None, upstream_runoff_volume=None, time_to_peak=None, peak_discharge=None, overwrite=None, verbose=None, quiet=None, superquiet=None)
Example:
gs.run_command("r.runoff", rainfall="name", curve_number="name", runoff_depth="name")
Parameters
rainfall=name [required]
Name of input rainfall depth raster map [mm] (event total)
duration=float
Storm duration D [hours] (used for time_to_peak and peak_discharge)
Allowed values: 0-
curve_number=name [required]
Name of input Curve Number raster map (0 < CN <= 100)
direction=name
Name of input flow direction raster map (for r.accumulate / r.watershed)
lambda=float
Initial abstraction ratio lambda (0 <= lambda <= 0.6)
Allowed values: 0-0.6
Default: 0.2
time_concentration=name
Name of input time of concentration raster map [hours]
runoff_depth=name [required]
Name for output runoff depth raster map [mm]
runoff_volume=name
Name for output per-cell runoff volume raster map [m3]
upstream_area=name
Name for optional output upstream drainage area raster map [km2]
upstream_runoff_depth=name
Name for optional output upstream area weighted average runoff depth raster map [mm]
upstream_runoff_volume=name
Name for optional output upstream runoff volume raster map [m3]
time_to_peak=name
Name for optional output time to peak raster map [hours]
peak_discharge=name
Name for optional output peak discharge raster map [m3/s]
--overwrite
Allow output files to overwrite existing files
--help
Print usage summary
--verbose
Verbose module output
--quiet
Quiet module output
--qq
Very quiet module output
--ui
Force launching GUI dialog
rainfall : str | np.ndarray, required
Name of input rainfall depth raster map [mm] (event total)
Used as: input, raster, name
duration : float, optional
Storm duration D [hours] (used for time_to_peak and peak_discharge)
Allowed values: 0-
curve_number : str | np.ndarray, required
Name of input Curve Number raster map (0 < CN <= 100)
Used as: input, raster, name
direction : str | np.ndarray, optional
Name of input flow direction raster map (for r.accumulate / r.watershed)
Used as: input, raster, name
lambda : float, optional
Initial abstraction ratio lambda (0 <= lambda <= 0.6)
Allowed values: 0-0.6
Default: 0.2
time_concentration : str | np.ndarray, optional
Name of input time of concentration raster map [hours]
Used as: input, raster, name
runoff_depth : str | type(np.ndarray) | type(np.array) | type(gs.array.array), required
Name for output runoff depth raster map [mm]
Used as: output, raster, name
runoff_volume : str | type(np.ndarray) | type(np.array) | type(gs.array.array), optional
Name for output per-cell runoff volume raster map [m3]
Used as: output, raster, name
upstream_area : str | type(np.ndarray) | type(np.array) | type(gs.array.array), optional
Name for optional output upstream drainage area raster map [km2]
Used as: output, raster, name
upstream_runoff_depth : str | type(np.ndarray) | type(np.array) | type(gs.array.array), optional
Name for optional output upstream area weighted average runoff depth raster map [mm]
Used as: output, raster, name
upstream_runoff_volume : str | type(np.ndarray) | type(np.array) | type(gs.array.array), optional
Name for optional output upstream runoff volume raster map [m3]
Used as: output, raster, name
time_to_peak : str | type(np.ndarray) | type(np.array) | type(gs.array.array), optional
Name for optional output time to peak raster map [hours]
Used as: output, raster, name
peak_discharge : str | type(np.ndarray) | type(np.array) | type(gs.array.array), optional
Name for optional output peak discharge raster map [m3/s]
Used as: output, raster, name
overwrite : bool, optional
Allow output files to overwrite existing files
Default: None
verbose : bool, optional
Verbose module output
Default: None
quiet : bool, optional
Quiet module output
Default: None
superquiet : bool, optional
Very quiet module output
Default: None
Returns:
result : grass.tools.support.ToolResult | np.ndarray | tuple[np.ndarray] | None
If the tool produces text as standard output, a ToolResult object will be returned. Otherwise, None will be returned. If an array type (e.g., np.ndarray) is used for one of the raster outputs, the result will be an array and will have the shape corresponding to the computational region. If an array type is used for more than one raster output, the result will be a tuple of arrays.
Raises:
grass.tools.ToolError: When the tool ended with an error.
rainfall : str, required
Name of input rainfall depth raster map [mm] (event total)
Used as: input, raster, name
duration : float, optional
Storm duration D [hours] (used for time_to_peak and peak_discharge)
Allowed values: 0-
curve_number : str, required
Name of input Curve Number raster map (0 < CN <= 100)
Used as: input, raster, name
direction : str, optional
Name of input flow direction raster map (for r.accumulate / r.watershed)
Used as: input, raster, name
lambda : float, optional
Initial abstraction ratio lambda (0 <= lambda <= 0.6)
Allowed values: 0-0.6
Default: 0.2
time_concentration : str, optional
Name of input time of concentration raster map [hours]
Used as: input, raster, name
runoff_depth : str, required
Name for output runoff depth raster map [mm]
Used as: output, raster, name
runoff_volume : str, optional
Name for output per-cell runoff volume raster map [m3]
Used as: output, raster, name
upstream_area : str, optional
Name for optional output upstream drainage area raster map [km2]
Used as: output, raster, name
upstream_runoff_depth : str, optional
Name for optional output upstream area weighted average runoff depth raster map [mm]
Used as: output, raster, name
upstream_runoff_volume : str, optional
Name for optional output upstream runoff volume raster map [m3]
Used as: output, raster, name
time_to_peak : str, optional
Name for optional output time to peak raster map [hours]
Used as: output, raster, name
peak_discharge : str, optional
Name for optional output peak discharge raster map [m3/s]
Used as: output, raster, name
overwrite : bool, optional
Allow output files to overwrite existing files
Default: None
verbose : bool, optional
Verbose module output
Default: None
quiet : bool, optional
Quiet module output
Default: None
superquiet : bool, optional
Very quiet module output
Default: None
DESCRIPTION
r.runoff computes event-based runoff using the SCS Curve Number (SCS-CN) method. For each raster cell, it calculates runoff depth (mm) and per-cell runoff volume (m³). With a flow-direction raster, it accumulates upstream contributing area to report total upstream runoff depth and volume. When storm duration and time of concentration are provided, it estimates time to peak (time of rise to the hydrograph peak) and peak discharge (m³/s), treating each cell as a local outlet. The SCS-CN method, developed by the USDA Soil Conservation Service (now NRCS), relates rainfall, soil hydrologic group, land cover, and antecedent wetness to storage to partition rainfall into initial abstraction (loss; represents interception, depression storage, and infiltration) and direct runoff.
It provides high-level estimates of how rain is partitioned at the land surface. When it rains, some water infiltrates, some is intercepted or evaporates, and the remainder becomes runoff. The SCS-CN method uses a Curve Number (CN) to represent watershed conditions (soil hydrologic group, land cover, and antecedent runoff condition) and to predict direct runoff. This is useful for screening-level flood planning and watershed management.
Inputs
rainfall: Required raster of event-total rainfall depth \((P)\) [mm]. Spatially varying precipitation (radar/satellite/gauge regridded). NULL cells imply no computation there (e.g., data gaps).
duration: Optional Storm duration \((D)\) [hours] (scalar). Needed to estimate time-to-peak and peak discharge. If omitted, timing-based outputs are skipped.
curve_number: Required raster of Curve Number [dimensionless],
\(0 \leq CN \leq 100\).
Encodes land cover, soil hydrologic group, and antecedent wetness.
Higher CN equals lower storage, which equals more runoff.
Out-of-range values should be sanitized or masked.
See r.curvenumber for further information or generating CN rasters.
direction: Flow-direction raster (GRASS-coded; from r.watershed or
r.stream.extract).
Required for upstream area/volume/depth and peak discharge; defines the drainage
network for accumulation.
lambda: Initial abstraction ratio \((\lambda)\) [dimensionless] (\(0 \leq \lambda < 0.6\); default 0.2). Controls early losses representing the initial abstraction ratio, or how much rain is lost to initial soil wetting before runoff begins (\(I_a = \lambda S\)). The default 0.2 is a standard assumption from SCS studies, but you can tweak it with local data (e.g., from soil surveys) to better match your area’s behavior. This initial loss is critical because it delays runoff until enough rain overcomes it. Some recent studies suggest 0.05.
time_concentration: Raster of time of concentration \((T_c)\) [h]. Time for runoff from the hydraulically most distant point to reach the pixel; often estimated (e.g., Kirpich). Required for time-to-peak and peak discharge; NULL where unknown.
Outputs
runoff_depth: A raster map of event runoff depth per cell [mm], calculated by the SCS-CN method. The method balances rainfall (\(P\)) against soil storage and initial loss using the following equation for Runoff \((Q)\):
where Storage \((S)\) is;
$$ S \;=\; \frac{25400}{CN} - 254 $$ and Initial abstraction \((I_a)\):
runoff_volume: A raster map of runoff volumeper cell \([m^3]\). Converts depth to meters and multiplies by CRS-aware cell area:
upstream_area: A raster map of total drainage area uphill of each cell, including the cell itself [km²]. This is accumulated using flow direction with \(A_{\uparrow} = \sum_{\text{upstream}} \frac{\text{area}_{\text{cell}}}{10^6}\), showing the watershed size feeding into each point—key for understanding flood risk across a network of cells.
upstream_runoff_depth: A raster map of the area-weighted average runoff depth uphill [mm], calculated as \(Q_{\uparrow} = \frac{V_{\uparrow}}{A_{\uparrow} \cdot 1000}\). It’s zero if no uphill area exists and NULL if data is missing
upstream_runoff_volume: A raster map of total upstream event volume per cell [m²], summed from per-cell volumes using flow direction as \(V_{\uparrow} \;=\; \sum_{\text{upstream}} V\). This gives a cumulative water total, critical for large-scale analysis of watershed runoff (e.g. estimating storage for a dam).
time_to_peak: A raster map of time to peak runoff per cell [h], computed as
where \(D\) is duration and \(T_c\) is time of concentration. This equation blends the storm’s length with how long water takes to flow, based on SCS guidelines. NULL wjere \(T_c\) is missing.
peak_discharge: A raster map of SCS Peak Discharge \((q_p)\) estimated per cell (as if each cell was a watershed outlet) \([m³/s]\), computed using the equation derived from the triangular approximation to the hydrograph and uses upstream area and upstream-average depth
where \(q_p\) is peak discharge [m³/s], \(A_{\uparrow}\) is upstream (contributing) area [km²], \(Q_{\uparrow}\) is upstream-average (area-weighted) runoff depth \([mm]\), \(t_p\) is time to peak \([h]\), and \(0.208\) is the SCS metric units factor.
Notes
- Metric units only. Inputs are mm and hours; outputs are mm, km², mm, m³, and m³/s.
- Upstream prerequisites. Any
upstream_*output requiresdirection. Timing outputs require bothtime_of_concentrationandduration.
EXAMPLE
# set the region
g.region -p raster=elevation

# generate the curve number
r.curvenumber landcover=lc_esa soil=hsg landcover_source=esa output=cn

# or generate a random CN raster for the sake of this workflow
r.mapcalc "cn = int(rand(30, 93))" seed=3093 --o

# generate flow direction and stream network
r.watershed elevation=elevation drainage=fdr stream=str threshold=10 --o

# calculate time of concentration
r.timeofconcentration elevation=elevation direction=fdr streams=str tc=tc length_min=100 --o

# generate a random precipitation raster between 15 and 100 mm
# (optional, if you do not have an actual rainfall raster)
r.mapcalc "pcp = int(rand(15, 100))" seed=15100 --o

# compute runoff depth and volume (simple SCS computation; does not require duration, tc or fdr)
r.runoff rainfall=pcp cn=cn lambda=0.2 runoff_depth=runoff_depth runoff_volume=runoff_volume --o

# compute cell by cell and upstream contributing runoff depth, runoff volume, and peak discharge
r.runoff rainfall=pcp duration=1 cn=cn direction=fdr lambda=0.2 tc=tc runoff_depth=runoff_depth ttp=ttp runoff_volume=runoff_volume upstream_area=upstream_area upstream_runoff_depth=upstream_runoff_depth upstream_runoff_volume=upstream_runoff_volume peak_discharge=peak_discharge --o
r.runoff also prints some important statistics including total runoff volume, maximum runoff depth, and peak discharge. For example, terminal output from the last command is;
Computing runoff depth [mm]
Computing per-cell volume [m³]
Total runoff volume: 2028504.82 m³
Maximum runoff depth: 76.68 mm
Computing upstream area [km²] and volume [m³]
Computing upstream-average runoff depth [mm]
Computing time to peak [hours]
Computing peak discharge [m³/s]
Peak discharge (max): 29.477 m³/s
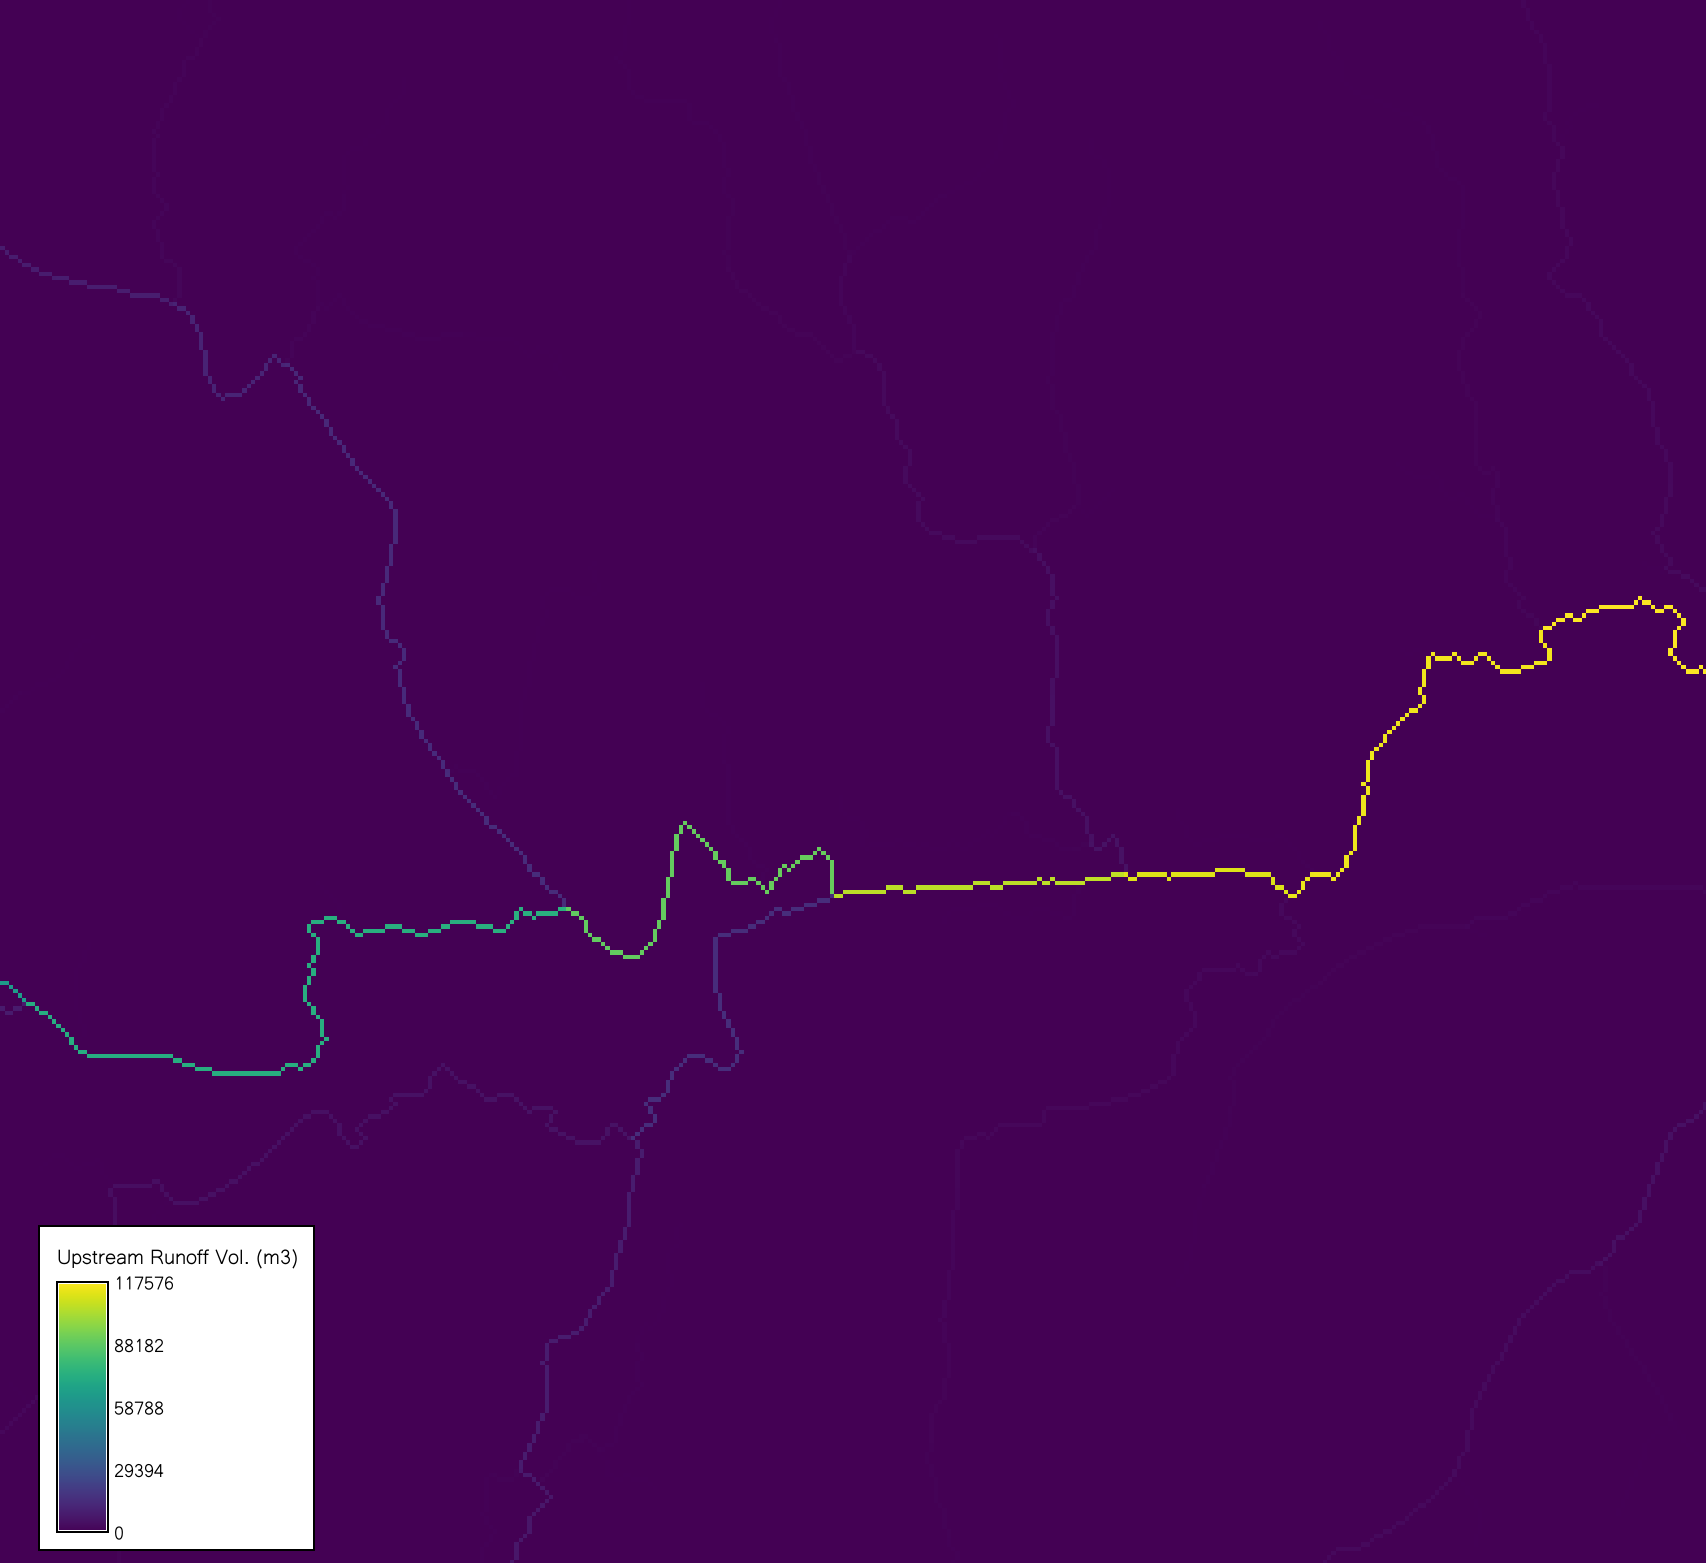 Figure1: Output upstream runoff volume raster from r.runoff sample run on NC
dataset zoomed in near the outlet
Figure1: Output upstream runoff volume raster from r.runoff sample run on NC
dataset zoomed in near the outlet
REFERENCES
- USDA Soil Conservation Service. 1986. Urban Hydrology for Small Watersheds (TR-55), 2nd ed., Washington, DC.
- Maidment, D. R. (Ed.). 1993. Handbook of Hydrology. New York: McGraw-Hill.
SEE ALSO
r.curvenumber, r.timeofconcentration
AUTHORS
Abdullah Azzam (HydroCS, Department of Civil and Environmental Engineering, New Mexico State University)
SOURCE CODE
Available at: r.runoff source code
(history)
Latest change: Friday Jun 05 06:31:20 2026 in commit 5a243d0