i.variance
Analyses variation of variance with variation of resolution
i.variance input=name [csv_output=name] [plot_output=name] [min_cells=integer] [max_size=float] step=float [--overwrite] [--verbose] [--quiet] [--qq] [--ui]
Example:
i.variance input=name min_cells=0 step=1
grass.tools.Tools.i_variance(input, csv_output=None, plot_output=None, min_cells=None, max_size=None, step=1, overwrite=None, verbose=None, quiet=None, superquiet=None)
Example:
tools = Tools()
tools.i_variance(input="name", min_cells=0, step=1)
This grass.tools API is experimental in version 8.5 and expected to be stable in version 8.6.
grass.script.run_command("i.variance", input, csv_output=None, plot_output=None, min_cells=None, max_size=None, step=1, overwrite=None, verbose=None, quiet=None, superquiet=None)
Example:
gs.run_command("i.variance", input="name", min_cells=0, step=1)
Parameters
input=name [required]
Raster band on which to perform analysis of variation of variance
csv_output=name
Name for output file
Name for output file
plot_output=name
Name for graphic output file for plot (extension decides format, - for screen)
Name for output file
min_cells=integer
Minimum number of cells at which to stop
max_size=float
Maximum pixel size (= minimum resolution) to analyse
step=float [required]
Step of resolution variation
Default: 1
--overwrite
Allow output files to overwrite existing files
--help
Print usage summary
--verbose
Verbose module output
--quiet
Quiet module output
--qq
Very quiet module output
--ui
Force launching GUI dialog
input : str | np.ndarray, required
Raster band on which to perform analysis of variation of variance
Used as: input, raster, name
csv_output : str, optional
Name for output file
Name for output file
Used as: output, file, name
plot_output : str, optional
Name for graphic output file for plot (extension decides format, - for screen)
Name for output file
Used as: output, file, name
min_cells : int, optional
Minimum number of cells at which to stop
max_size : float, optional
Maximum pixel size (= minimum resolution) to analyse
step : float, required
Step of resolution variation
Default: 1
overwrite : bool, optional
Allow output files to overwrite existing files
Default: None
verbose : bool, optional
Verbose module output
Default: None
quiet : bool, optional
Quiet module output
Default: None
superquiet : bool, optional
Very quiet module output
Default: None
Returns:
result : grass.tools.support.ToolResult | None
If the tool produces text as standard output, a ToolResult object will be returned. Otherwise, None will be returned.
Raises:
grass.tools.ToolError: When the tool ended with an error.
input : str, required
Raster band on which to perform analysis of variation of variance
Used as: input, raster, name
csv_output : str, optional
Name for output file
Name for output file
Used as: output, file, name
plot_output : str, optional
Name for graphic output file for plot (extension decides format, - for screen)
Name for output file
Used as: output, file, name
min_cells : int, optional
Minimum number of cells at which to stop
max_size : float, optional
Maximum pixel size (= minimum resolution) to analyse
step : float, required
Step of resolution variation
Default: 1
overwrite : bool, optional
Allow output files to overwrite existing files
Default: None
verbose : bool, optional
Verbose module output
Default: None
quiet : bool, optional
Quiet module output
Default: None
superquiet : bool, optional
Very quiet module output
Default: None
DESCRIPTION
Following the Woodcock and Strahler (1987), i.variance resamples a raster input layer (normally a remotely sensed image) to successively decreasing resolutions and calculates the mean local variance of the entire image at each resolution. Local variance is defined as the variance in a 3x3 window.
The modules starts at the current computing region resolution and then decreases the resolution (increases the pixel size) by step until it reaches the maximum size of pixels (aka minimum resolution) determined by the max_size parameter, or when the number of total pixels falls below min_cells. If both are given, min_cells takes precedence.
Resampling to lower resolution uses the average of higher resolution pixels.
By default, the module prints a comma separated list to stdout containing each resolution that represents a local maximum of variance (higher variance than the resolution before and after in the iterations) as well as the difference in variance with the neighbor with most similar variance.
In addition, the user can choose to output the results in the form of a graph plotting variance against resolution (plot_output) either to a file by giving a file name (its extension determines the output format) or to the screen using '-'. The entire data of variance depending on resolution can also be saved in a csv file using csv_output.
NOTES
The aim of this module is to provide diagnostics to the user about the size of detectable "objects" in an image. This can provide helpful input to modules that take a window size or desired object size as input, such as, for example, r.texture and i.segment.
As Woodcock and Strahler (1980) write: "The reasoning behind this measure is as follows. If the spatial resolution is considerably finer than the objects in the scene, most of the measurements in the image will be highly correlated with their neighbors and a measure of local variance will be low. If the objects approximate the size of the resolution cells, then the likelihood of neighbors being similar decreases and the local variance rises. As the size of the resolution cells increase and many objects are found in a single resolution cell, the local variance decreases."
EXAMPLE
The three examples based on the North Carolina demo data orthophoto show how different types of objects in images lead to different forms of the variance curve with different resolutions showing peak values of variance.
Region 1
g.region n=220558 s=220066 w=639394 e=640114 res=1 -p
i.variance ortho_2001_t792_1m@PERMANENT max_size=50 plot=region1_plot.png


resolution,min_diff
1,29.2433
12,0.820265
14,2.75311
19,0.300205
23,3.85219
26,4.47146
28,1.30447
34,10.3549
36,5.48933
40,8.77106
42,9.19453
47,8.14879
50,3.92238
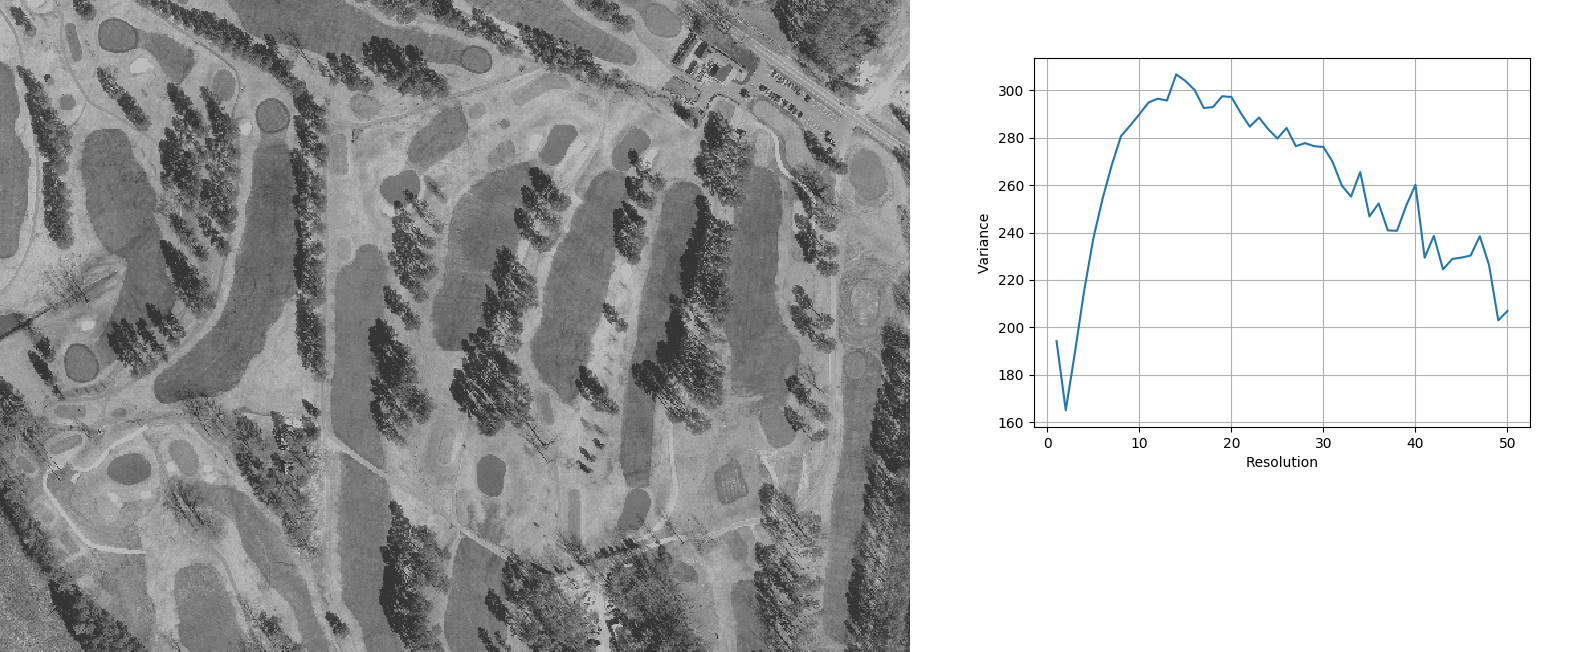
Image of region 1 and plot of variance against resolution.
The highest peak at ca. 15m corresponds to the average distance between
fairways. Local maxima between 40m and 50m correspond to the average
width of fairways.
Region 2
g.region n=222166 s=221890 w=637562 e=637966 res=1 -p
i.variance ortho_2001_t792_1m@PERMANENT max_size=50 plot=region2_plot.png


resolution,min_diff
1,108.991
6,1.65447
8,0.296192
12,2.46681
19,15.3195
23,11.8194
28,1.7359
30,21.5443
33,30.5452
36,4.32951
40,6.17552
46,12.1585
48,22.9854
50,22.0149
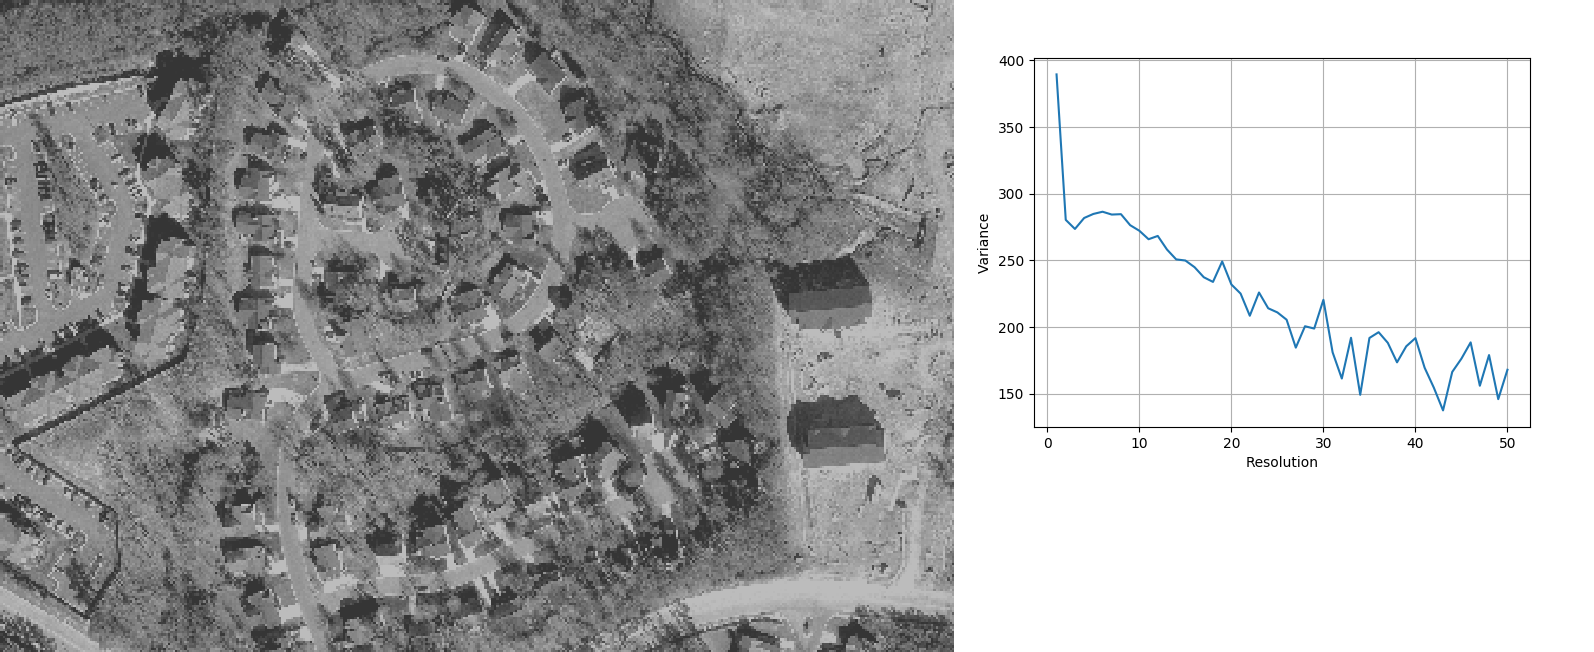
Image of region 2 and plot of variance against resolution
The abundance of small objects leads to a peak close to the 1m original
resolution. The plateau between 5m and 10m corresponds to the houses.
Local maxima between 30m and 50m seem to correspond to the larger houses
and higher vegetation areas.
Region 3
g.region n=220723 s=220218 w=638347 e=639086 res=1
i.variance ortho_2001_t792_1m@PERMANENT max_size=50 plot=region3_plot.png


resolution,min_diff
1,47.6132
18,0.911684
21,6.41979
23,0.737023
25,7.311
27,1.77098
30,10.2106
33,2.5862
37,8.43631
39,9.10274
41,5.67096
44,1.48503
47,5.0448
50,0.622958
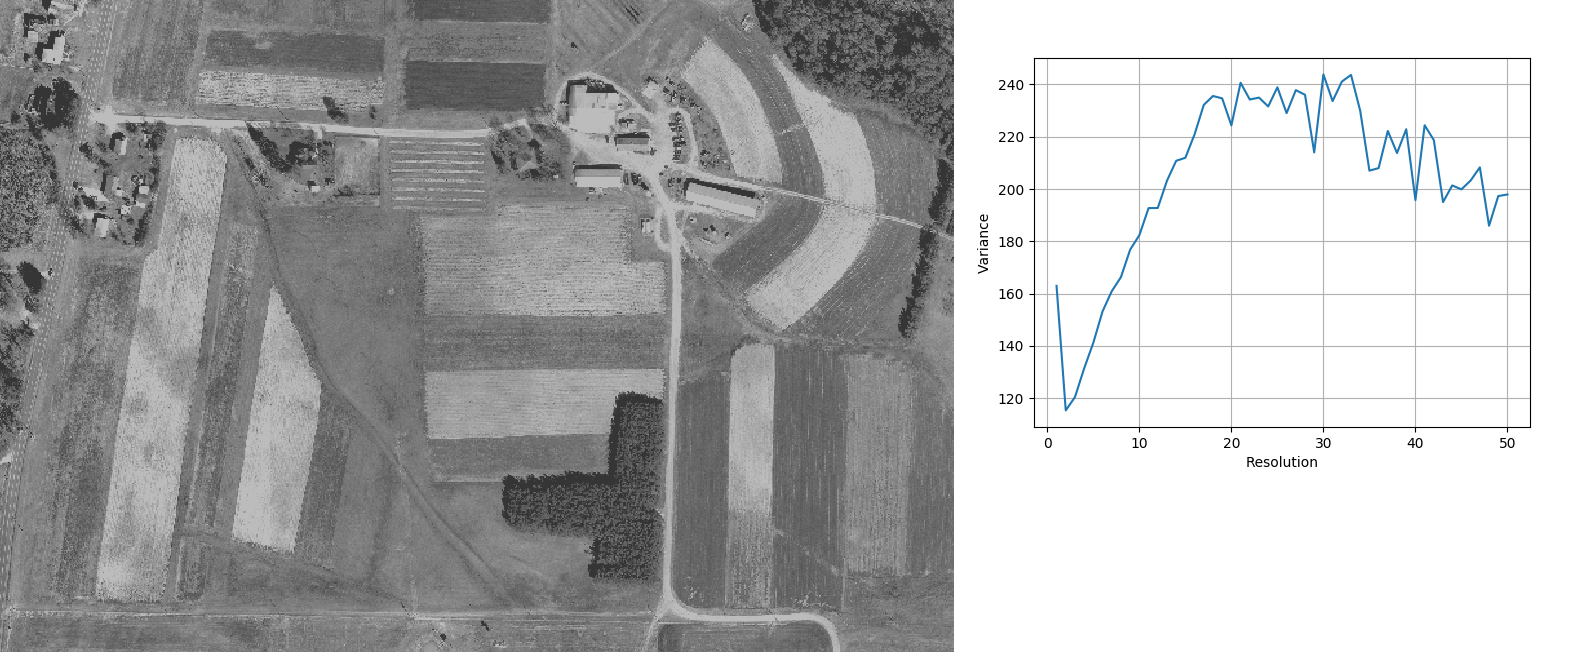
Image of region 3 and plot of variance against resolution
The overall peak beyond 30m corresponds to the width of fields.
REFERENCES
Woodcock, C.E., Strahler, A.H., 1987. The factor of scale in remote sensing. Remote Sensing of Environment 21, 311–332. https://doi.org/10.1016/0034-4257(87)90015-0
SEE ALSO
i.segment, r.resamp.stats, r.neighbors, r.univar, r.texture
AUTHOR
Moritz Lennert
SOURCE CODE
Available at: i.variance source code
(history)
Latest change: Thursday Mar 05 14:47:35 2026 in commit 4c42dd0