d.shade
Drapes a color raster over an shaded relief or aspect map.
d.shade [-n] shade=name color=name [brighten=integer] [--verbose] [--quiet] [--qq] [--ui]
Example:
d.shade shade=name color=name
grass.tools.Tools.d_shade(shade, color, brighten=0, flags=None, verbose=None, quiet=None, superquiet=None)
Example:
tools = Tools()
tools.d_shade(shade="name", color="name")
This grass.tools API is experimental in version 8.5 and expected to be stable in version 8.6.
grass.script.run_command("d.shade", shade, color, brighten=0, flags=None, verbose=None, quiet=None, superquiet=None)
Example:
gs.run_command("d.shade", shade="name", color="name")
Parameters
shade=name [required]
Name of shaded relief or aspect raster map
color=name [required]
Name of raster to drape over relief raster map
Typically, this raster is elevation or other colorful raster
brighten=integer
Percent to brighten
Allowed values: -99-99
Default: 0
-n
Respect NULL values while drawing
--help
Print usage summary
--verbose
Verbose module output
--quiet
Quiet module output
--qq
Very quiet module output
--ui
Force launching GUI dialog
shade : str | np.ndarray, required
Name of shaded relief or aspect raster map
Used as: input, raster, name
color : str | np.ndarray, required
Name of raster to drape over relief raster map
Typically, this raster is elevation or other colorful raster
Used as: input, raster, name
brighten : int, optional
Percent to brighten
Allowed values: -99-99
Default: 0
flags : str, optional
Allowed values: n
n
Respect NULL values while drawing
verbose : bool, optional
Verbose module output
Default: None
quiet : bool, optional
Quiet module output
Default: None
superquiet : bool, optional
Very quiet module output
Default: None
Returns:
result : grass.tools.support.ToolResult | None
If the tool produces text as standard output, a ToolResult object will be returned. Otherwise, None will be returned.
Raises:
grass.tools.ToolError: When the tool ended with an error.
shade : str, required
Name of shaded relief or aspect raster map
Used as: input, raster, name
color : str, required
Name of raster to drape over relief raster map
Typically, this raster is elevation or other colorful raster
Used as: input, raster, name
brighten : int, optional
Percent to brighten
Allowed values: -99-99
Default: 0
flags : str, optional
Allowed values: n
n
Respect NULL values while drawing
verbose : bool, optional
Verbose module output
Default: None
quiet : bool, optional
Quiet module output
Default: None
superquiet : bool, optional
Very quiet module output
Default: None
DESCRIPTION
d.shade will drape a color raster map over a shaded relief map. In place of shaded relief, any raster map can be used including aspect or slope. The color raster map is usually an elevation raster map with colorful color table (as opposed to gray scale color table). However, any raster map can be used including categorical raster maps.
The advantage of this module is that it allows visualizing the shaded map without a need to create a new raster which would combine both. Comparing to creating shaded relief as semi-transparent overlay on the color raster map, this module gives result with more saturated colors.
The input for this module can be created for example using
r.slope.aspect or r.relief
.
NOTES
Refer to the d.his help page for more details; d.shade is simply a frontend to that module.
EXAMPLES
In this example, the aspect map in the North Carolina sample dataset
is used to hillshade the elevation map:
g.region raster=aspect -p
d.mon wx0
d.shade shade=aspect color=elevation
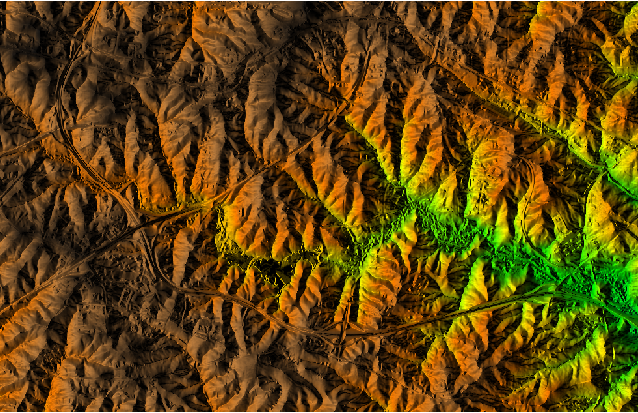
Figure: A detail of raster created by applying shading effect of aspect to elevation raster map from North Carolina dataset elevation map
In this next example, a shaded relief raster map is created and used to create a colorized hillshade:
g.region raster=elevation
r.relief input=elevation output=elevation_shaded_relief

d.mon wx1
d.shade shade=elevation_shaded_relief color=elevation
Interesting visualizations can be created using different color tables
for elevation raster map, for example using haxby color table.
SEE ALSO
d.his, g.pnmcomp, r.shade,
r.slope.aspect, r.relief
wxGUI 3D viewer (NVIZ)
AUTHORS
Unknown; updated to GRASS 5.7 by Michael Barton
SOURCE CODE
Available at: d.shade source code
(history)
Latest change: Monday Dec 15 16:57:16 2025 in commit dd421a0