d.histogram
Displays a histogram in the form of a pie or bar chart for a user-specified raster map.
d.histogram [-nc] map=name [style=string] [color=name] [bgcolor=name] [nsteps=integer] [--verbose] [--quiet] [--qq] [--ui]
Example:
d.histogram map=name
grass.tools.Tools.d_histogram(map, style="bar", color="black", bgcolor="white", nsteps=255, flags=None, verbose=None, quiet=None, superquiet=None)
Example:
tools = Tools()
tools.d_histogram(map="name")
This grass.tools API is experimental in version 8.5 and expected to be stable in version 8.6.
grass.script.run_command("d.histogram", map, style="bar", color="black", bgcolor="white", nsteps=255, flags=None, verbose=None, quiet=None, superquiet=None)
Example:
gs.run_command("d.histogram", map="name")
Parameters
map=name [required]
Raster map for which histogram will be displayed
style=string
Indicate if a pie or bar chart is desired
Allowed values: pie, bar
Default: bar
color=name
Color for text and axes
Either a standard color name or R:G:B triplet
Default: black
bgcolor=name
Background color
Either a standard color name, R:G:B triplet, or "none"
Default: white
nsteps=integer
Number of steps to divide the data range into (fp maps only)
Default: 255
-n
Display information for null cells
-c
Report for ranges defined in cats file (fp maps only)
--help
Print usage summary
--verbose
Verbose module output
--quiet
Quiet module output
--qq
Very quiet module output
--ui
Force launching GUI dialog
map : str | np.ndarray, required
Raster map for which histogram will be displayed
Used as: input, raster, name
style : str, optional
Indicate if a pie or bar chart is desired
Allowed values: pie, bar
Default: bar
color : str, optional
Color for text and axes
Either a standard color name or R:G:B triplet
Used as: input, color, name
Default: black
bgcolor : str, optional
Background color
Either a standard color name, R:G:B triplet, or "none"
Used as: input, color, name
Default: white
nsteps : int, optional
Number of steps to divide the data range into (fp maps only)
Default: 255
flags : str, optional
Allowed values: n, c
n
Display information for null cells
c
Report for ranges defined in cats file (fp maps only)
verbose : bool, optional
Verbose module output
Default: None
quiet : bool, optional
Quiet module output
Default: None
superquiet : bool, optional
Very quiet module output
Default: None
Returns:
result : grass.tools.support.ToolResult | None
If the tool produces text as standard output, a ToolResult object will be returned. Otherwise, None will be returned.
Raises:
grass.tools.ToolError: When the tool ended with an error.
map : str, required
Raster map for which histogram will be displayed
Used as: input, raster, name
style : str, optional
Indicate if a pie or bar chart is desired
Allowed values: pie, bar
Default: bar
color : str, optional
Color for text and axes
Either a standard color name or R:G:B triplet
Used as: input, color, name
Default: black
bgcolor : str, optional
Background color
Either a standard color name, R:G:B triplet, or "none"
Used as: input, color, name
Default: white
nsteps : int, optional
Number of steps to divide the data range into (fp maps only)
Default: 255
flags : str, optional
Allowed values: n, c
n
Display information for null cells
c
Report for ranges defined in cats file (fp maps only)
verbose : bool, optional
Verbose module output
Default: None
quiet : bool, optional
Quiet module output
Default: None
superquiet : bool, optional
Very quiet module output
Default: None
DESCRIPTION
d.histogram displays the category-value distribution for a user-specified raster map layer, in the form of a bar chart or a pie chart. The display will be displayed in the active display frame on the graphics monitor, using the colors in the raster map layer's color table. The program determines the raster map's category value distribution by counting cells.
NOTES
d.histogram respects the current geographic region settings and the current raster mask (if mask is active).
d.histogram uses the colors in the map's color look-up table (i.e., the map's colr or colr2 file).
EXAMPLES
Running the command below will generate the bar graph shown in the figure:
g.region raster=elevation -p
d.mon wx0
d.histogram map=elevation
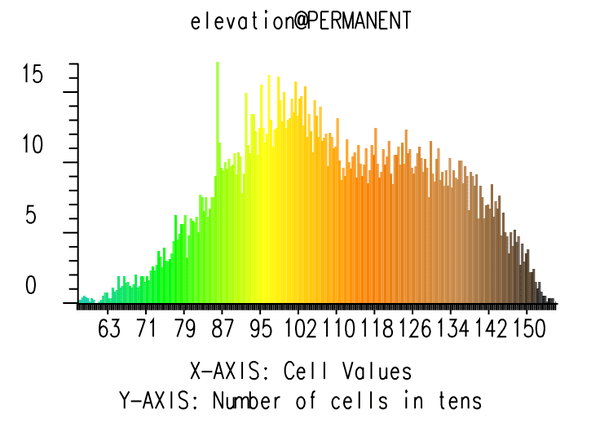
Figure: Bar graph histogram for elevation map
Running the command below will generate the pie graph shown in the figure:
g.region raster=landuse96_28m -p
d.histogram map=landuse96_28m style=pie
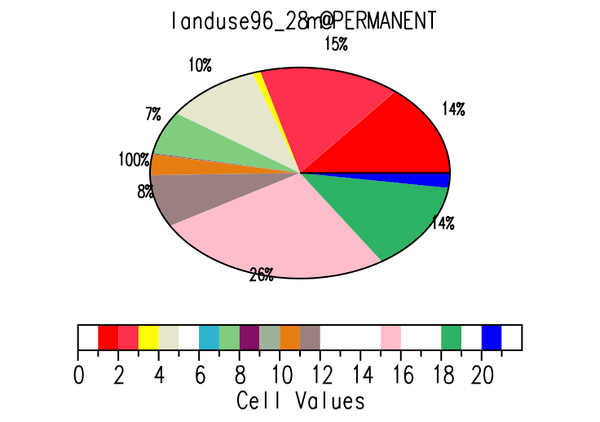
Figure: Pie graph histogram for landuse map
SEE ALSO
d.colortable, d.frame, d.graph, d.linegraph, d.mon, d.polar, g.region, r.stats
AUTHOR
Dave Johnson
DBA Systems, Inc.
10560 Arrowhead Drive
Fairfax, Virginia 22030
SOURCE CODE
Available at: d.histogram source code
(history)
Latest change: Friday Sep 05 13:38:04 2025 in commit 6112ef0