Note: This document is for an older version of GRASS GIS that has been discontinued. You should upgrade, and read the current manual page.
NAME
r.watershed - Calculates hydrological parameters and RUSLE factors.KEYWORDS
raster, hydrology, watershed, accumulation, drainage, stream network, stream power index, topographic indexSYNOPSIS
Flags:
- -s
- SFD (D8) flow (default is MFD)
- SFD: single flow direction, MFD: multiple flow direction
- -4
- Allow only horizontal and vertical flow of water
- -m
- Enable disk swap memory option: Operation is slow
- Only needed if memory requirements exceed available RAM; see manual on how to calculate memory requirements
- -a
- Use positive flow accumulation even for likely underestimates
- See manual for a detailed description of flow accumulation output
- -b
- Beautify flat areas
- Flow direction in flat areas is modified to look prettier
- --overwrite
- Allow output files to overwrite existing files
- --help
- Print usage summary
- --verbose
- Verbose module output
- --quiet
- Quiet module output
- --ui
- Force launching GUI dialog
Parameters:
- elevation=name [required]
- Name of input elevation raster map
- depression=name
- Name of input depressions raster map
- All non-NULL and non-zero cells are considered as real depressions
- flow=name
- Name of input raster representing amount of overland flow per cell
- disturbed_land=name
- Name of input raster map percent of disturbed land
- For USLE
- blocking=name
- Name of input raster map blocking overland surface flow
- For USLE. All non-NULL and non-zero cells are considered as blocking terrain.
- retention=name
- Name of input raster map with percentages for flow accumulation.
- threshold=integer
- Minimum size of exterior watershed basin
- max_slope_length=float
- Maximum length of surface flow in map units
- For USLE
- accumulation=name
- Name for output accumulation raster map
- Number of cells that drain through each cell
- tci=name
- Name for output topographic index ln(a / tan(b)) map
- spi=name
- Name for output stream power index a * tan(b)
- Name for output raster map
- drainage=name
- Name for output drainage direction raster map
- Directions numbered from 1 to 8
- basin=name
- Name for output basins raster map
- stream=name
- Name for output stream segments raster map
- half_basin=name
- Name for output half basins raster map
- Each half-basin is given a unique value
- length_slope=name
- Name for output slope length raster map
- Slope length and steepness (LS) factor for USLE
- slope_steepness=name
- Name for output slope steepness raster map
- Slope steepness (S) factor for USLE
- convergence=integer
- Convergence factor for MFD (1-10)
- 1 = most diverging flow, 10 = most converging flow. Recommended: 5
- Default: 5
- memory=memory in MB
- Maximum memory to be used (in MB)
- Cache size for raster rows
- Default: 300
Table of contents
DESCRIPTION
r.watershed generates a set of maps indicating: 1) flow accumulation, drainage direction, the location of streams and watershed basins, and 2) the LS and S factors of the Revised Universal Soil Loss Equation (RUSLE).NOTES
Without flag -m set, the entire analysis is run in memory maintained by the operating system. This can be limiting, but is very fast. Setting this flag causes the program to manage memory on disk which allows very large maps to be processed but is slower.Flag -s force the module to use single flow direction (SFD, D8) instead of multiple flow direction (MFD). MFD is enabled by default.
By -4 flag the user allow only horizontal and vertical flow of water. Stream and slope lengths are approximately the same as outputs from default surface flow (allows horizontal, vertical, and diagonal flow of water). This flag will also make the drainage basins look more homogeneous.
When -a flag is specified the module will use positive flow accumulation even for likely underestimates. When this flag is not set, cells with a flow accumulation value that is likely to be an underestimate are converted to the negative. See below for a detailed description of flow accumulation output.
Option convergence specifies convergence factor for MFD. Lower values result in higher divergence, flow is more widely distributed. Higher values result in higher convergence, flow is less widely distributed, becoming more similar to SFD.
Option elevation specifies the elevation data on which entire analysis is based. NULL (nodata) cells are ignored, zero and negative values are valid elevation data. Gaps in the elevation map that are located within the area of interest must be filled beforehand, e.g. with r.fillnulls, to avoid distortions. The elevation map need not be sink-filled because the module uses a least-cost algorithm.
Option depression specifies the optional map of actual depressions or sinkholes in the landscape that are large enough to slow and store surface runoff from a storm event. All cells that are not NULL and not zero indicate depressions. Water will flow into but not out of depressions.
Raster flow map specifies amount of overland flow per cell. This map indicates the amount of overland flow units that each cell will contribute to the watershed basin model. Overland flow units represent the amount of overland flow each cell contributes to surface flow. If omitted, a value of one (1) is assumed.
Raster retention map specifies correction factors per cell for flow distribution. This map indicates the percentage of overland flow units leaving each cell. Values should be between zero and 100. If omitted, a value of 100 is assumed.
Input Raster map or value containing the percent of disturbed land (i.e., croplands, and construction sites) where the raster or input value of 17 equals 17%. If no map or value is given, r.watershed assumes no disturbed land. This input is used for the RUSLE calculations.
Option blocking specifies terrain that will block overland surface flow. Blocking cells and streams stop the slope length for the RUSLE. All cells that are not NULL and not zero indicate blocking terrain.
Option threshold specifies the minimum size of an exterior watershed basin in cells, if no flow map is input, or overland flow units when a flow map is given. Warning: low threshold values will dramactically increase run time and generate difficult to read basin and half_basin results. This parameter also controls the level of detail in the stream segments map.
Value given by max_slope_length option indicates the maximum length of overland surface flow in meters. If overland flow travels greater than the maximum length, the program assumes the maximum length (it assumes that landscape characteristics not discernible in the digital elevation model exist that maximize the slope length). This input is used for the RUSLE calculations and is a sensitive parameter.
Output accumulation map contains the absolute value of the amount of overland flow that traverses each cell. This value will be the number of upland cells plus one if no overland flow map is given. If the overland flow map is given, the value will be in overland flow units. Negative numbers indicate that those cells possibly have surface runoff from outside of the current geographic region. Thus, any cells with negative values cannot have their surface runoff and sedimentation yields calculated accurately.
Output tci raster map contains topographic index TCI, computed as ln(α / tan(β)) where α is the cumulative upslope area draining through a point per unit contour length and tan(β) is the local slope angle. The TCI reflects the tendency of water to accumulate at any point in the catchment and the tendency for gravitational forces to move that water downslope (Quinn et al. 1991). This value will be negative if α / tan(β) < 1.
Output spi raster map contains stream power index SPI, computed as α * tan(β) where α is the cumulative upslope area draining through a point per unit contour length and tan(β) is the local slope angle. The SPI reflects the power of water flow at any point in the catchment and the tendency for gravitational forces to move that water downslope (Moore et al. 1991). This value will be negative if α < 0, i.e. for cells with possible surface runoff from outside of the current geographic region.
Output drainage raster map contains drainage direction. Provides the "aspect" for each cell measured CCW from East.
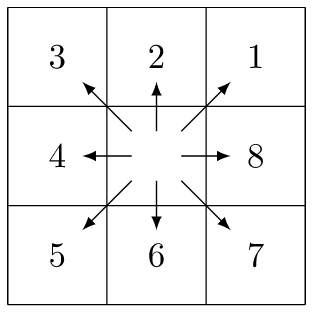
Figure: Drainage is 8 directions numbered counter-clockwise starting from 1 in north-east direction (source)
The output basin map contains unique label for each watershed basin. Each basin will be given a unique positive even integer. Areas along edges may not be large enough to create an exterior watershed basin. NULL values indicate that the cell is not part of a complete watershed basin in the current geographic region.
The output stream contains stream segments. Values correspond to the watershed basin values. Can be vectorized after thinning (r.thin) with r.to.vect.
The output half_basin raster map stores each half-basin is given a unique value. Watershed basins are divided into left and right sides. The right-hand side cell of the watershed basin (looking upstream) are given even values corresponding to the values in basin. The left-hand side cells of the watershed basin are given odd values which are one less than the value of the watershed basin.
The output length_slope raster map stores slope length and steepness (LS) factor for the Revised Universal Soil Loss Equation (RUSLE). Equations taken from Revised Universal Soil Loss Equation for Western Rangelands (Weltz et al. 1987). Since the LS factor is a small number (usually less than one), the GRASS output map is of type DCELL.
The output slope_steepness raster map stores slope steepness (S) factor for the Universal Soil Loss Equation (RUSLE). Equations taken from article entitled Revised Slope Steepness Factor for the Universal Soil Loss Equation (McCool et al. 1987). Since the S factor is a small number (usually less than one), the GRASS output map is of type DCELL.
AT least-cost search algorithm
r.watershed uses an AT least-cost search algorithm (see REFERENCES section) designed to minimize the impact of DEM data errors. Compared to r.terraflow, this algorithm provides more accurate results in areas of low slope as well as DEMs constructed with techniques that mistake canopy tops as the ground elevation. Kinner et al. (2005), for example, used SRTM and IFSAR DEMs to compare r.watershed against r.terraflow results in Panama. r.terraflow was unable to replicate stream locations in the larger valleys while r.watershed performed much better. Thus, if forest canopy exists in valleys, SRTM, IFSAR, and similar data products will cause major errors in r.terraflow stream output. Under similar conditions, r.watershed will generate better stream and half_basin results. If watershed divides contain flat to low slope, r.watershed will generate better basin results than r.terraflow. (r.terraflow uses the same type of algorithm as ESRI's ArcGIS watershed software which fails under these conditions.) Also, if watershed divides contain forest canopy mixed with uncanopied areas using SRTM, IFSAR, and similar data products, r.watershed will generate better basin results than r.terraflow. The algorithm produces results similar to those obtained when running r.cost and r.drain on every cell on the raster map.Multiple flow direction (MFD)
r.watershed offers two methods to calculate surface flow: single flow direction (SFD, D8) and multiple flow direction (MFD). With MFD, water flow is distributed to all neighbouring cells with lower elevation, using slope towards neighbouring cells as a weighing factor for proportional distribution. The AT least-cost path is always included. As a result, depressions and obstacles are traversed with a graceful flow convergence before the overflow. The convergence factor causes flow accumulation to converge more strongly with higher values. The supported range is 1 to 10, recommended is a convergence factor of 5 (Holmgren, 1994). If many small sliver basins are created with MFD, setting the convergence factor to a higher value can reduce the amount of small sliver basins.In-memory mode and disk swap mode
There are two versions of this program: ram and seg. ram is used by default, seg can be used by setting the -m flag.The ram version requires a maximum of 31 MB of RAM for 1 million cells. Together with the amount of system memory (RAM) available, this value can be used to estimate whether the current region can be processed with the ram version.
The ram version uses virtual memory managed by the operating system to store all the data structures and is faster than the seg version; seg uses the GRASS segmentation library which manages data in disk files. seg uses only as much system memory (RAM) as specified with the memory option, allowing other processes to operate on the same system, even when the current geographic region is huge.
Due to memory requirements of both programs, it is quite easy to run out of memory when working with huge map regions. If the ram version runs out of memory and the resolution size of the current geographic region cannot be increased, either more memory needs to be added to the computer, or the swap space size needs to be increased. If seg runs out of memory, additional disk space needs to be freed up for the program to run. The r.terraflow module was specifically designed with huge regions in mind and may be useful here as an alternative, although disk space requirements of r.terraflow are several times higher than of seg.
Large regions with many cells
The upper limit of the ram version is 2 billion (231 - 1) cells, whereas the upper limit for the seg version is 9 billion-billion (263 - 1 = 9.223372e+18) cells.In some situations, the region size (number of cells) may be too large for the amount of time or memory available. Running r.watershed may then require use of a coarser resolution. To make the results more closely resemble the finer terrain data, create a map layer containing the lowest elevation values at the coarser resolution. This is done by: 1) Setting the current geographic region equal to the elevation map layer with g.region, and 2) Use the r.neighbors or r.resamp.stats command to find the lowest value for an area equal in size to the desired resolution. For example, if the resolution of the elevation data is 30 meters and the resolution of the geographic region for r.watershed will be 90 meters: use the minimum function for a 3 by 3 neighborhood. After changing to the resolution at which r.watershed will be run, r.watershed should be run using the values from the neighborhood output map layer that represents the minimum elevation within the region of the coarser cell.
Basin threshold
The minimum size of drainage basins, defined by the threshold parameter, is only relevant for those watersheds with a single stream having at least the threshold of cells flowing into it. (These watersheds are called exterior basins.) Interior drainage basins contain stream segments below multiple tributaries. Interior drainage basins can be of any size because the length of an interior stream segment is determined by the distance between the tributaries flowing into it.MASK and no data
The r.watershed program does not require the user to have the current geographic region filled with elevation values. Areas without elevation data (masked or NULL cells) are ignored. It is NOT necessary to create a raster map (or raster reclassification) named MASK for NULL cells. Areas without elevation data will be treated as if they are off the edge of the region. Such areas will reduce the memory necessary to run the program. Masking out unimportant areas can significantly reduce processing time if the watersheds of interest occupy a small percentage of the overall area.Gaps (NULL cells) in the elevation map that are located within the area of interest will heavily influence the analysis: water will flow into but not out of these gaps. These gaps must be filled beforehand, e.g. with r.fillnulls.
Zero (0) and negative values will be treated as elevation data (not no_data).
Further processing of output layers
Problem areas, i.e. those parts of a basin with a likely underestimate of flow accumulation, can be easily identified with e.g.r.mapcalc "problems = if(flow_acc < 0, basin, null())"
To isolate an individual river network using the output of this module, a number of approaches may be considered.
- Use a resample of the basins catchment raster map as a MASK.
The equivalent vector map method is similar using v.select or v.overlay. - Use the r.cost module with a point in the river as a starting point.
- Use the v.net.iso module with a node in the river as a starting point.
To create river mile segmentation from a vectorized streams map, try the v.net.iso or v.lrs.segment modules.
The stream segments output can be easily vectorized after thinning with r.thin. Each stream segment in the vector map will have the value of the associated basin. To isolate subbasins and streams for a larger basin, a MASK for the larger basin can be created with r.water.outlet. The stream segments output serves as a guide where to place the outlet point used as input to r.water.outlet. The basin threshold must have been sufficiently small to isolate a stream network and subbasins within the larger basin.
Given that the drainage is 8 directions numbered counter-clockwise starting from 1 in north-east direction, multiplying the output by 45 (by 45. to get a double precision floating point raster map in r.mapcalc) gives the directions in degrees. For most applications, zeros which indicate depressions specified by depression and negative values which indicate runoff leaving the region should be replaced by NULL (null() in r.mapcalc). The following command performs these replacements:
r.mapcalc "drainage_degrees = if(drainage > 0, 45. * drainage, null())"
EXAMPLES
These examples use the Spearfish sample dataset.Convert r.watershed streams map output to a vector map
If you want a detailed stream network, set the threshold option small to create lots of catchment basins, as only one stream is presented per catchment. The r.to.vect -v flag preserves the catchment ID as the vector category number.r.watershed elev=elevation.dem stream=rwater.stream r.to.vect -v in=rwater.stream out=rwater_stream
Set a different color table for the accumulation map:
  MAP=rwater.accum
  r.watershed elev=elevation.dem accum=$MAP

  eval `r.univar -g "$MAP"`
  stddev_x_2=`echo $stddev | awk '{print $1 * 2}'`
  stddev_div_2=`echo $stddev | awk '{print $1 / 2}'`

  r.colors $MAP col=rules << EOF
    0% red
    -$stddev_x_2 red
    -$stddev yellow
    -$stddev_div_2 cyan
    -$mean_of_abs blue
    0 white
    $mean_of_abs blue
    $stddev_div_2 cyan
    $stddev yellow
    $stddev_x_2 red
    100% red
  EOF
Create a more detailed stream map using the accumulation map and convert it to a vector output map. The accumulation cut-off, and therefore fractal dimension, is arbitrary; in this example we use the map's mean number of upstream catchment cells (calculated in the above example by r.univar) as the cut-off value. This only works with SFD, not with MFD.
  r.watershed elev=elevation.dem accum=rwater.accum

  r.mapcalc 'MASK = if(!isnull(elevation.dem))'
  r.mapcalc "rwater.course = \
   if( abs(rwater.accum) > $mean_of_abs, \
       abs(rwater.accum), \
       null() )"
  r.colors -g rwater.course col=bcyr
  g.remove -f type=raster name=MASK

  # Thinning is required before converting raster lines to vector
  r.thin in=rwater.course out=rwater.course.Thin
  r.colors -gn rwater.course.Thin color=grey
  r.to.vect in=rwater.course.Thin out=rwater_course type=line
  v.db.dropcolumn map=rwater_course column=label
Create watershed basins map and convert to a vector polygon map
  r.watershed elev=elevation.dem basin=rwater.basin thresh=15000
  r.to.vect -s in=rwater.basin out=rwater_basins type=area
  v.db.dropcolumn map=rwater_basins column=label
  v.db.renamecolumn map=rwater_basins column=value,catchment
Display output in a nice way
  r.relief map=elevation.dem
  d.shade shade=elevation.dem.shade color=rwater.basin bright=40
  d.vect rwater_course color=orange
REFERENCES
- Ehlschlaeger C. (1989). Using the AT Search Algorithm
to Develop Hydrologic Models from Digital Elevation Data,
Proceedings of International Geographic Information Systems (IGIS)
Symposium '89, pp 275-281 (Baltimore, MD, 18-19 March 1989).
URL: http://chuck.ehlschlaeger.info/older/IGIS/paper.html - Holmgren P. (1994). Multiple flow direction algorithms for runoff
modelling in grid based elevation models: An empirical evaluation.
Hydrological Processes Vol 8(4), 327-334.
DOI: 10.1002/hyp.3360080405 - Kinner D., Mitasova H., Harmon R., Toma L., Stallard R. (2005).
GIS-based Stream Network Analysis for The Chagres River Basin,
Republic of Panama. The Rio Chagres: A Multidisciplinary Profile of
a Tropical Watershed, R. Harmon (Ed.), Springer/Kluwer, p.83-95.
URL: http://www4.ncsu.edu/~hmitaso/measwork/panama/panama.html - McCool et al. (1987). Revised Slope Steepness Factor for the Universal Soil Loss Equation, Transactions of the ASAE Vol 30(5).
- Metz M., Mitasova H., Harmon R. (2011). Efficient extraction of
drainage networks from massive, radar-based elevation models with least
cost path search, Hydrol. Earth Syst. Sci. Vol 15, 667-678.
DOI: 10.5194/hess-15-667-2011 -
Moore I.D., Grayson R.B., Ladson A.R. (1991). Digital terrain
modelling: a review of hydrogical, geomorphological, and biological
applications, Hydrological Processes, Vol 5(1), 3-30
DOI: 10.1002/hyp.3360050103 - Quinn P., K. Beven K., Chevallier P., Planchon O. (1991). The
prediction of hillslope flow paths for distributed hydrological modelling
using Digital Elevation Models, Hydrological Processes Vol 5(1),
p.59-79.
DOI: 10.1002/hyp.3360050106 - Weltz M. A., Renard K.G., Simanton J. R. (1987). Revised Universal Soil Loss Equation for Western Rangelands, U.S.A./Mexico Symposium of Strategies for Classification and Management of Native Vegetation for Food Production In Arid Zones (Tucson, AZ, 12-16 Oct. 1987).
SEE ALSO
g.region, r.cost, r.drain, r.fillnulls, r.flow, r.mask, r.neighbors, r.param.scale, r.resamp.interp, r.terraflow, r.topidx, r.water.outlet, r.stream.extractAUTHORS
Original version: Charles Ehlschlaeger, U.S. Army Construction Engineering Research LaboratoryFaster sorting algorithm and MFD support: Markus Metz <markus.metz.giswork at gmail.com>
Retention for flow distribution by Andreas Gericke (IGB Berlin)
SOURCE CODE
Available at: r.watershed source code (history)
Latest change: Wednesday Aug 26 07:19:54 2020 in commit: db45a242d8d49fe1b7dc73063837f4206054176e
Main index | Raster index | Topics index | Keywords index | Graphical index | Full index
© 2003-2023 GRASS Development Team, GRASS GIS 7.8.9dev Reference Manual