i.hyper.explore
Visualize spectra from hyperspectral 3D raster maps.
i.hyper.explore [-p] map=name [,name,...] [coordinates=east,north [,east,north,...]] [points=name] [uncertainty=name] [output=name] [dpi=integer] [style_scale=float] [--overwrite] [--verbose] [--quiet] [--qq] [--ui]
Example:
i.hyper.explore map=name
grass.tools.Tools.i_hyper_explore(map, coordinates=None, points=None, uncertainty=None, output=None, dpi=300, style_scale=1.0, flags=None, overwrite=None, verbose=None, quiet=None, superquiet=None)
Example:
tools = Tools()
tools.i_hyper_explore(map="name")
This grass.tools API is experimental in version 8.5 and expected to be stable in version 8.6.
grass.script.run_command("i.hyper.explore", map, coordinates=None, points=None, uncertainty=None, output=None, dpi=300, style_scale=1.0, flags=None, overwrite=None, verbose=None, quiet=None, superquiet=None)
Example:
gs.run_command("i.hyper.explore", map="name")
Parameters
map=name [,name,...] [required]
Input 3D raster map(s) with hyperspectral data (comma-separated)
coordinates=east,north [,east,north,...]
Comma separated list of coordinates
points=name
Name of input vector map
Point vector map with query locations
uncertainty=name
Optional standard uncertainty 3D raster map for a single input map
output=name
Output plot file (.png, .pdf, .svg). If not set, opens an interactive window
Name for output file
dpi=integer
DPI value for output image (used only with output=)
Default: 300
style_scale=float
Scale factor for fonts and line widths when exporting (e.g., 1.8)
Default: 1.0
-p
Print JSON to stdout instead of plotting
--overwrite
Allow output files to overwrite existing files
--help
Print usage summary
--verbose
Verbose module output
--quiet
Quiet module output
--qq
Very quiet module output
--ui
Force launching GUI dialog
map : str | list[str], required
Input 3D raster map(s) with hyperspectral data (comma-separated)
Used as: input, raster_3d, name
coordinates : list[tuple[float, float]] | tuple[float, float] | list[float] | str, optional
Comma separated list of coordinates
Used as: input, coords, east,north
points : str, optional
Name of input vector map
Point vector map with query locations
Used as: input, vector, name
uncertainty : str, optional
Optional standard uncertainty 3D raster map for a single input map
Used as: input, raster_3d, name
output : str, optional
Output plot file (.png, .pdf, .svg). If not set, opens an interactive window
Name for output file
Used as: output, file, name
dpi : int, optional
DPI value for output image (used only with output=)
Default: 300
style_scale : float, optional
Scale factor for fonts and line widths when exporting (e.g., 1.8)
Default: 1.0
flags : str, optional
Allowed values: p
p
Print JSON to stdout instead of plotting
overwrite : bool, optional
Allow output files to overwrite existing files
Default: None
verbose : bool, optional
Verbose module output
Default: None
quiet : bool, optional
Quiet module output
Default: None
superquiet : bool, optional
Very quiet module output
Default: None
Returns:
result : grass.tools.support.ToolResult | None
If the tool produces text as standard output, a ToolResult object will be returned. Otherwise, None will be returned.
Raises:
grass.tools.ToolError: When the tool ended with an error.
map : str | list[str], required
Input 3D raster map(s) with hyperspectral data (comma-separated)
Used as: input, raster_3d, name
coordinates : list[tuple[float, float]] | tuple[float, float] | list[float] | str, optional
Comma separated list of coordinates
Used as: input, coords, east,north
points : str, optional
Name of input vector map
Point vector map with query locations
Used as: input, vector, name
uncertainty : str, optional
Optional standard uncertainty 3D raster map for a single input map
Used as: input, raster_3d, name
output : str, optional
Output plot file (.png, .pdf, .svg). If not set, opens an interactive window
Name for output file
Used as: output, file, name
dpi : int, optional
DPI value for output image (used only with output=)
Default: 300
style_scale : float, optional
Scale factor for fonts and line widths when exporting (e.g., 1.8)
Default: 1.0
flags : str, optional
Allowed values: p
p
Print JSON to stdout instead of plotting
overwrite : bool, optional
Allow output files to overwrite existing files
Default: None
verbose : bool, optional
Verbose module output
Default: None
quiet : bool, optional
Quiet module output
Default: None
superquiet : bool, optional
Very quiet module output
Default: None
DESCRIPTION
i.hyper.explore visualizes spectra extracted from hyperspectral 3D
raster maps (raster_3d). It allows users to interactively inspect
spectral signatures at given map coordinates or from point vector maps.
The module supports multiple 3D raster maps simultaneously for
comparison (e.g., original data, preprocessed data, or reduced
components).
Each queried location is sampled across all spectral bands using
r3.what. The resulting spectral curves are plotted or printed in JSON
format (with the -p flag). If an output file is specified
(output=), the figure is exported instead of being shown
interactively.
i.hyper.explore automatically reads wavelength metadata, measurement
type (e.g., reflectance, radiance), and units from hyper.json
produced by i.hyper.import or
i.hyper.preproc. If the map contains principal
components or other dimensionally reduced features, the module detects
this and adjusts the X-axis to component indices.
FUNCTIONALITY
- Query spectra from one or more 3D raster maps at arbitrary locations.
- Plot spectral curves for all queried points, automatically handling units and wavelength axes.
- Detects whether the data represent reflectance, radiance, or dimensional components from metadata.
- Export plots to
.png,.pdf, or.svgviaoutput=. - Optionally output structured JSON data for external analysis with the -p flag.
- Automatically labels plots based on measurement type, units, and number of components.
- Supports coordinate pairs (
coordinates=) and vector point maps (points=). - Automatically displays a translucent
+/- 1 sigmaenvelope when a matching atmospheric-correction uncertainty 3D raster map is available. Useuncertainty=to select the 3D raster map explicitly for a single input map.
NOTES
- Wavelength metadata must be available in
hyper.json. - The module uses
r3.whatto extract band values at each 2D location. - If the raster represents dimensional components (e.g., PCA, NMF), the plot's X-axis switches to "Components".
- The output plot resolution can be set with
dpi=. - Line width and font size can be scaled with
style_scale=(default: 1.0). - Line colors correspond to query points; linestyles correspond to input maps.
- Interactive plots support renaming legends and saving figures directly from the viewer.
EXAMPLES
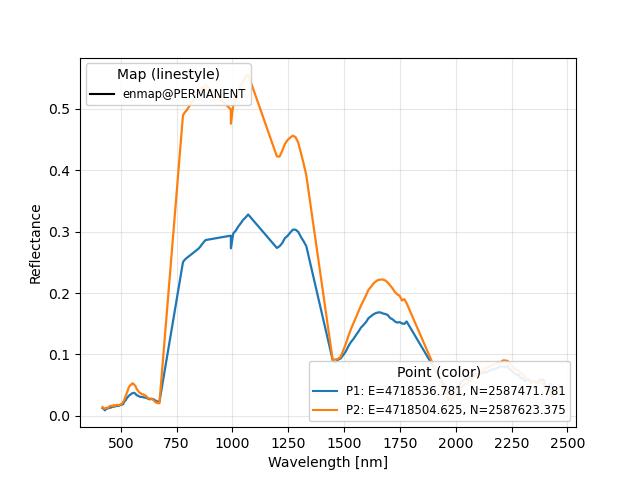
::: code # Example 1: Compare spectra from EnMAP 3D raster map at two locations i.hyper.explore map=enmap@PERMANENT \ coordinates=4718536.78125,2587471.78125,4718504.625,2587623.375 :::
::: {align="center" style="margin: 10px"}
 {width="640" height="480"
border="0"}\
Figure: Reflectance spectra plots generated with i.hyper.explore\
[Data source: Copyright © 2012--2025 EnMAP at Earth Observation Center
EOC of DLR.]{.small}
:::
{width="640" height="480"
border="0"}\
Figure: Reflectance spectra plots generated with i.hyper.explore\
[Data source: Copyright © 2012--2025 EnMAP at Earth Observation Center
EOC of DLR.]{.small}
:::
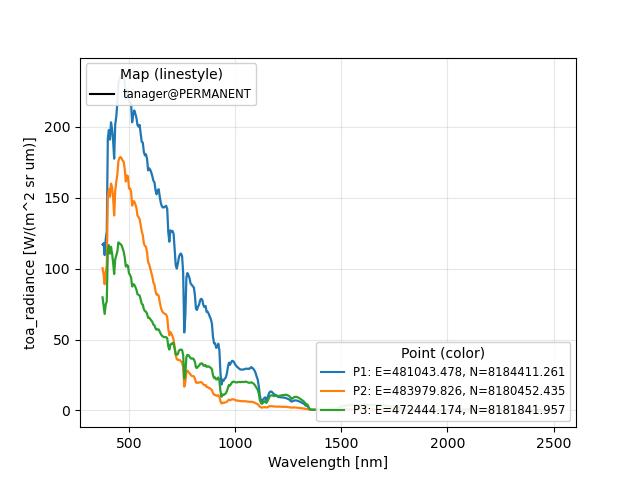
::: code # Example 2: Explore multiple spectra from Tanager 3D raster map i.hyper.explore map=tanager@PERMANENT \ coordinates=481043.478,8184411.261,483979.826,8180452.435,472444.174,8181841.957 :::
::: {align="center" style="margin: 10px"}
 {width="640" height="480"
border="0"}\
Figure: Radiance spectra plots generated with i.hyper.explore\
[Data source: Planet Labs -- Open Data, CC-BY-4.0.]{.small}
:::
{width="640" height="480"
border="0"}\
Figure: Radiance spectra plots generated with i.hyper.explore\
[Data source: Planet Labs -- Open Data, CC-BY-4.0.]{.small}
:::
DEPENDENCIES
- GRASS module:
r3.what
AUTHORS
Tomaž Žagar and Alen Mangafić, Geodetic Institute of Slovenia
SOURCE CODE
Available at: i.hyper.explore source code
(history)
Latest change: Wednesday Sep 16 14:49:52 2026 in commit 9b0a4cb