v.histogram
Draws the histogram of values in a vector attribute column
v.histogram [-hrg] map=name [layer=string] column=name [where=sql_query] [bins=integer] output=name [plot_dimensions=string] [dpi=integer] [fontsize=integer] [style=string] [axis_limits=string] [color=name] [border_color=name] [border_width=float] [rwidth=float] [--overwrite] [--verbose] [--quiet] [--qq] [--ui]
Example:
v.histogram map=name column=name output=-
grass.tools.Tools.v_histogram(map, layer="1", column, where=None, bins=30, output="-", plot_dimensions=None, dpi=100, fontsize=10, style=None, axis_limits=None, color="", border_color="", border_width=None, rwidth=None, flags=None, overwrite=None, verbose=None, quiet=None, superquiet=None)
Example:
tools = Tools()
tools.v_histogram(map="name", column="name", output="-")
This grass.tools API is experimental in version 8.5 and expected to be stable in version 8.6.
grass.script.run_command("v.histogram", map, layer="1", column, where=None, bins=30, output="-", plot_dimensions=None, dpi=100, fontsize=10, style=None, axis_limits=None, color="", border_color="", border_width=None, rwidth=None, flags=None, overwrite=None, verbose=None, quiet=None, superquiet=None)
Example:
gs.run_command("v.histogram", map="name", column="name", output="-")
Parameters
map=name [required]
Name of vector map
Or data source for direct OGR access
layer=string
Layer number or name
Vector features can have category values in different layers. This number determines which layer to use. When used with direct OGR access this is the layer name.
Default: 1
column=name [required]
Attribute column to create histogram from
where=sql_query
WHERE conditions of SQL statement without 'where' keyword
Example: income < 1000 and population >= 10000
bins=integer
Number of bins in histogram
Default: 30
output=name [required]
Name for graphic output file for plot (extension decides format, - for screen)
Name for output file
Default: -
plot_dimensions=string
Plot dimensions
Dimensions (width,height) of the figure in inches
dpi=integer
DPI
Resolution of plot
Default: 100
fontsize=integer
Font size
Default font size
Default: 10
style=string
Matplotlib style
Matplotlib style sheet, see https://matplotlib.org/stable/gallery/style_sheets/style_sheets_reference.html
axis_limits=string
Limit value axis [min,max]
min and max value of the value axis (x-axis, or y-axis if -h flag is set)
color=name
Color of the bars
Fill color of the histogram bars. Defaults to the style palette. See manual for color notation.
border_color=name
Color of the bar borders
Color of the histogram bar borders. Defaults to the Matplotlib default.
border_width=float
Border line width
Line width of the bar borders. Defaults to the Matplotlib default.
rwidth=float
Relative bar width
Width of the bars as a fraction of the bin width (0.1,1]
Allowed values: 0.1-1
-h
Horizontal histogram
Draw the histogram horizontal
-r
Rotate labels
Rotate the value-axis labels
-g
Add grid lines
Add grid lines
--overwrite
Allow output files to overwrite existing files
--help
Print usage summary
--verbose
Verbose module output
--quiet
Quiet module output
--qq
Very quiet module output
--ui
Force launching GUI dialog
map : str, required
Name of vector map
Or data source for direct OGR access
Used as: input, vector, name
layer : str, optional
Layer number or name
Vector features can have category values in different layers. This number determines which layer to use. When used with direct OGR access this is the layer name.
Used as: input, layer
Default: 1
column : str, required
Attribute column to create histogram from
Used as: input, dbcolumn, name
where : str, optional
WHERE conditions of SQL statement without 'where' keyword
Example: income < 1000 and population >= 10000
Used as: input, sql_query, sql_query
bins : int, optional
Number of bins in histogram
Default: 30
output : str, required
Name for graphic output file for plot (extension decides format, - for screen)
Name for output file
Used as: output, file, name
Default: -
plot_dimensions : str, optional
Plot dimensions
Dimensions (width,height) of the figure in inches
dpi : int, optional
DPI
Resolution of plot
Default: 100
fontsize : int, optional
Font size
Default font size
Default: 10
style : str, optional
Matplotlib style
Matplotlib style sheet, see https://matplotlib.org/stable/gallery/style_sheets/style_sheets_reference.html
axis_limits : str, optional
Limit value axis [min,max]
min and max value of the value axis (x-axis, or y-axis if -h flag is set)
color : str, optional
Color of the bars
Fill color of the histogram bars. Defaults to the style palette. See manual for color notation.
Used as: input, color, name
border_color : str, optional
Color of the bar borders
Color of the histogram bar borders. Defaults to the Matplotlib default.
Used as: input, color, name
border_width : float, optional
Border line width
Line width of the bar borders. Defaults to the Matplotlib default.
rwidth : float, optional
Relative bar width
Width of the bars as a fraction of the bin width (0.1,1]
Allowed values: 0.1-1
flags : str, optional
Allowed values: h, r, g
h
Horizontal histogram
Draw the histogram horizontal
r
Rotate labels
Rotate the value-axis labels
g
Add grid lines
Add grid lines
overwrite : bool, optional
Allow output files to overwrite existing files
Default: None
verbose : bool, optional
Verbose module output
Default: None
quiet : bool, optional
Quiet module output
Default: None
superquiet : bool, optional
Very quiet module output
Default: None
Returns:
result : grass.tools.support.ToolResult | None
If the tool produces text as standard output, a ToolResult object will be returned. Otherwise, None will be returned.
Raises:
grass.tools.ToolError: When the tool ended with an error.
map : str, required
Name of vector map
Or data source for direct OGR access
Used as: input, vector, name
layer : str, optional
Layer number or name
Vector features can have category values in different layers. This number determines which layer to use. When used with direct OGR access this is the layer name.
Used as: input, layer
Default: 1
column : str, required
Attribute column to create histogram from
Used as: input, dbcolumn, name
where : str, optional
WHERE conditions of SQL statement without 'where' keyword
Example: income < 1000 and population >= 10000
Used as: input, sql_query, sql_query
bins : int, optional
Number of bins in histogram
Default: 30
output : str, required
Name for graphic output file for plot (extension decides format, - for screen)
Name for output file
Used as: output, file, name
Default: -
plot_dimensions : str, optional
Plot dimensions
Dimensions (width,height) of the figure in inches
dpi : int, optional
DPI
Resolution of plot
Default: 100
fontsize : int, optional
Font size
Default font size
Default: 10
style : str, optional
Matplotlib style
Matplotlib style sheet, see https://matplotlib.org/stable/gallery/style_sheets/style_sheets_reference.html
axis_limits : str, optional
Limit value axis [min,max]
min and max value of the value axis (x-axis, or y-axis if -h flag is set)
color : str, optional
Color of the bars
Fill color of the histogram bars. Defaults to the style palette. See manual for color notation.
Used as: input, color, name
border_color : str, optional
Color of the bar borders
Color of the histogram bar borders. Defaults to the Matplotlib default.
Used as: input, color, name
border_width : float, optional
Border line width
Line width of the bar borders. Defaults to the Matplotlib default.
rwidth : float, optional
Relative bar width
Width of the bars as a fraction of the bin width (0.1,1]
Allowed values: 0.1-1
flags : str, optional
Allowed values: h, r, g
h
Horizontal histogram
Draw the histogram horizontal
r
Rotate labels
Rotate the value-axis labels
g
Add grid lines
Add grid lines
overwrite : bool, optional
Allow output files to overwrite existing files
Default: None
verbose : bool, optional
Verbose module output
Default: None
quiet : bool, optional
Quiet module output
Default: None
superquiet : bool, optional
Very quiet module output
Default: None
DESCRIPTION
v.histogram draws a histogram of the values in a vector map attribute column. Use the where option to select a subset of the records and bins to set the number of bars.
The histogram can be drawn horizontally (-h), with grid lines (-g), rotated value-axis labels (-r), and a limited value axis (axis_limits). The bar color, border_color, border_width and relative bar width (rwidth) can be set. A Matplotlib style sheet can be applied with the style option, e.g. style=ggplot. The fontsize, figure size (plot_dimensions, in inches) and resolution (dpi) can be set as well.
The plot_output parameter determines whether the result is displayed
on screen (default, -) or exported to a graphics file, with the format
taken from the file extension.
Options to customize the appearance of the plot include, among others, rotating the plot and x-axis labels, setting font size, and defining the colors of various plot components. The style option applies a Matplotlib style sheet to the plot, e.g. style=ggplot.
EXAMPLE
Show the histogram of median age values in the census block map:
v.histogram map=censusblk_swwake column=MEDIAN_AGE where="TOTAL_POP>0"
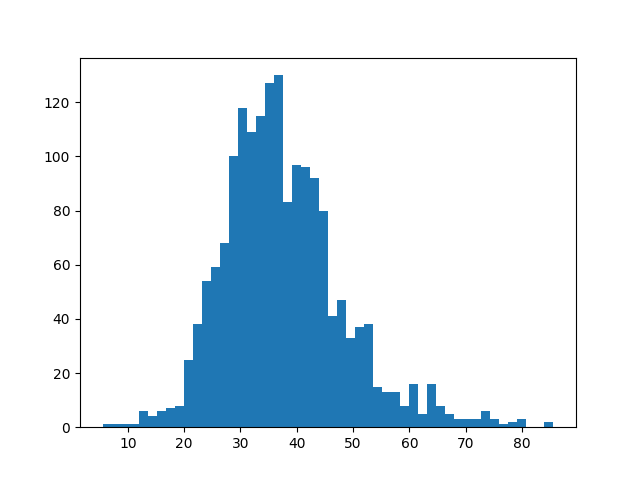
Histogram of median age values in census blocks
Show the same histogram, but apply the ggplot stylesheet, and plot the bars horizontally.
v.histogram map=censusblk_swwake column=MEDIAN_AGE where="TOTAL_POP>0" \
style="ggplot" plot_dimensions="6,5" -h
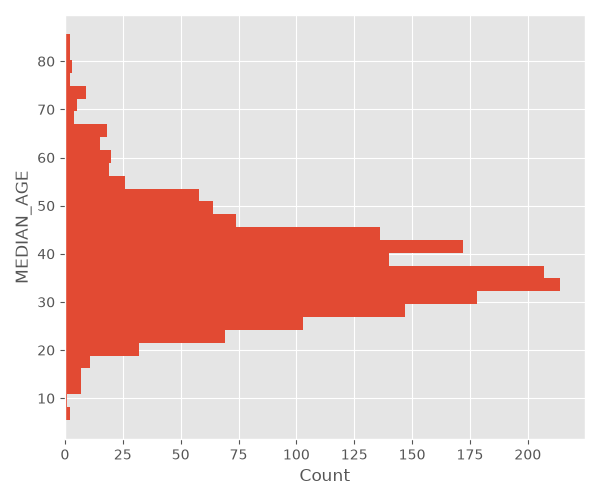
Histogram of median age values in census blocks
AUTHOR
Moritz Lennert (original code)
Paulo van Breugel (added style sheet, plot and histogram format options)
SOURCE CODE
Available at: v.histogram source code
(history)
Latest change: Wednesday Sep 30 02:05:52 2026 in commit c9c0885