r.out.kde
Exports raster with variable transparency into an image file
r.out.kde input=name background=name output=name [method=string] [--overwrite] [--verbose] [--quiet] [--qq] [--ui]
Example:
r.out.kde input=name background=name output=name
grass.tools.Tools.r_out_kde(input, background, output, method=None, overwrite=None, verbose=None, quiet=None, superquiet=None)
Example:
tools = Tools()
tools.r_out_kde(input="name", background="name", output="name")
This grass.tools API is experimental in version 8.5 and expected to be stable in version 8.6.
grass.script.run_command("r.out.kde", input, background, output, method=None, overwrite=None, verbose=None, quiet=None, superquiet=None)
Example:
gs.run_command("r.out.kde", input="name", background="name", output="name")
Parameters
input=name [required]
Raster map to be rendered with semi-transparency
background=name [required]
Background raster map
output=name [required]
Rendered output file
method=string
Method to scale transparency
Allowed values: linear, logistic
--overwrite
Allow output files to overwrite existing files
--help
Print usage summary
--verbose
Verbose module output
--quiet
Quiet module output
--qq
Very quiet module output
--ui
Force launching GUI dialog
input : str | np.ndarray, required
Raster map to be rendered with semi-transparency
Used as: input, raster, name
background : str | np.ndarray, required
Background raster map
Used as: input, raster, name
output : str, required
Rendered output file
Used as: output, file, name
method : str, optional
Method to scale transparency
Allowed values: linear, logistic
overwrite : bool, optional
Allow output files to overwrite existing files
Default: None
verbose : bool, optional
Verbose module output
Default: None
quiet : bool, optional
Quiet module output
Default: None
superquiet : bool, optional
Very quiet module output
Default: None
Returns:
result : grass.tools.support.ToolResult | None
If the tool produces text as standard output, a ToolResult object will be returned. Otherwise, None will be returned.
Raises:
grass.tools.ToolError: When the tool ended with an error.
input : str, required
Raster map to be rendered with semi-transparency
Used as: input, raster, name
background : str, required
Background raster map
Used as: input, raster, name
output : str, required
Rendered output file
Used as: output, file, name
method : str, optional
Method to scale transparency
Allowed values: linear, logistic
overwrite : bool, optional
Allow output files to overwrite existing files
Default: None
verbose : bool, optional
Verbose module output
Default: None
quiet : bool, optional
Quiet module output
Default: None
superquiet : bool, optional
Very quiet module output
Default: None
DESCRIPTION
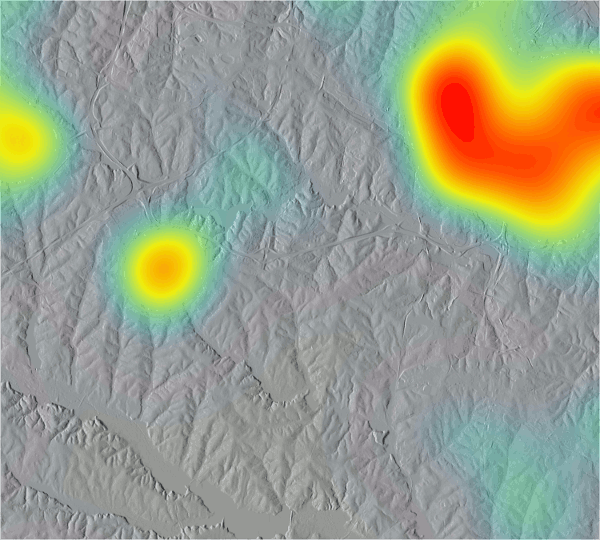
r.out.kde creates an image file (e.g., PNG, JPG, or GIF) where the input raster is rendered on top of background raster with varying transparency based on the values of the input raster. This can be used for example for visualization of kernel density estimate (KDE).
With logistic method, values are scaled so that lower values are more transparent and higher values are more opaque than with linear scaling.
This module requires Python Imaging Library (already required for GRASS GIS).
EXAMPLE
In this example, we visualize KDE of schools on top of shaded relief map.
g.region raster=elevation
# create background map
r.relief input=elevation output=relief
# compute kernel density estimate
v.kernel input=schools_wake output=schools_density radius=4000 multiplier=1000000
r.colors map=schools_density color=bcyr
r.out.kde input=schools_density background=relief method=logistic output=output.png
SEE ALSO
AUTHOR
Anna Petrasova, NCSU GeoForAll Lab
SOURCE CODE
Available at: r.out.kde source code
(history)
Latest change: Wednesday Mar 11 08:17:30 2026 in commit 2a14bbb