r.colors.stddev
Sets color rules based on stddev from a raster map's mean value.
r.colors.stddev [-bz] map=name [--verbose] [--quiet] [--qq] [--ui]
Example:
r.colors.stddev map=name
grass.tools.Tools.r_colors_stddev(map, flags=None, verbose=None, quiet=None, superquiet=None)
Example:
tools = Tools()
tools.r_colors_stddev(map="name")
This grass.tools API is experimental in version 8.5 and expected to be stable in version 8.6.
grass.script.run_command("r.colors.stddev", map, flags=None, verbose=None, quiet=None, superquiet=None)
Example:
gs.run_command("r.colors.stddev", map="name")
Parameters
map=name [required]
Name of raster map
-b
Color using standard deviation bands
-z
Force center at zero
--help
Print usage summary
--verbose
Verbose module output
--quiet
Quiet module output
--qq
Very quiet module output
--ui
Force launching GUI dialog
map : str | np.ndarray, required
Name of raster map
Used as: input, raster, name
flags : str, optional
Allowed values: b, z
b
Color using standard deviation bands
z
Force center at zero
verbose : bool, optional
Verbose module output
Default: None
quiet : bool, optional
Quiet module output
Default: None
superquiet : bool, optional
Very quiet module output
Default: None
Returns:
result : grass.tools.support.ToolResult | None
If the tool produces text as standard output, a ToolResult object will be returned. Otherwise, None will be returned.
Raises:
grass.tools.ToolError: When the tool ended with an error.
map : str, required
Name of raster map
Used as: input, raster, name
flags : str, optional
Allowed values: b, z
b
Color using standard deviation bands
z
Force center at zero
verbose : bool, optional
Verbose module output
Default: None
quiet : bool, optional
Quiet module output
Default: None
superquiet : bool, optional
Very quiet module output
Default: None
DESCRIPTION
r.colors.stddev set raster map color rules based on standard deviations from a map's mean value, either as a continuous color gradient or in color bands per standard deviation (S.D.) from the mean.
With the color band option values less that 1 S.D. from the mean are colored green, within 1-2 S.D. are colored yellow, within 2-3 S.D. are colored red, and beyond 3 S.D. are colored black.
For a differences map there is an option to lock the center of the color table at zero. Values more than two S.D. below the mean will be colored blue; values below the mean but less than 2 S.D. away will transition to white, and above the mean the colors will similarly transition to full red at +2 S.D.
EXAMPLE
North Carolina sample dataset:
g.region raster=elevation -p
r.colors.stddev elevation
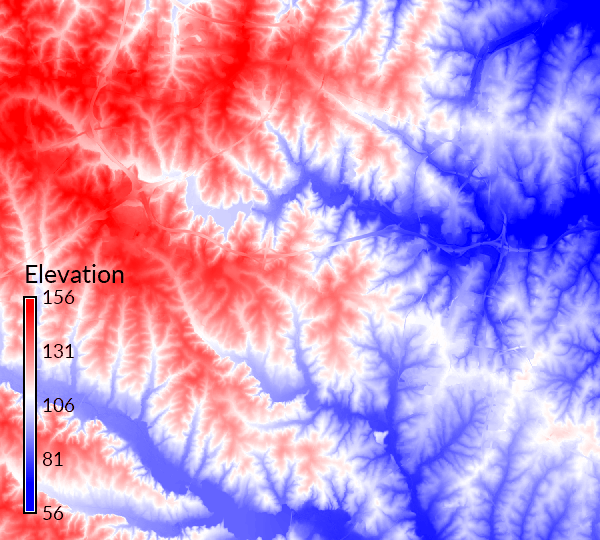
Figure: Standard deviations from mean elevation
SEE ALSO
AUTHOR
Hamish Bowman, Dunedin, New Zealand
SOURCE CODE
Available at: r.colors.stddev source code
(history)
Latest change: Friday Jun 05 05:57:52 2026 in commit ce20541