r.dem.screen
Regional screening: fuse topographic and spectral change
r.dem.screen dod=name [spectral_change=name] output=name [topo_threshold=float] [spectral_threshold=float] [infrastructure=name] [hazard_output=name] [infra_buffer_m=float] [--overwrite] [--verbose] [--quiet] [--qq] [--ui]
Example:
r.dem.screen dod=name output=name
grass.tools.Tools.r_dem_screen(dod, spectral_change=None, output, topo_threshold=1.0, spectral_threshold=-0.15, infrastructure=None, hazard_output=None, infra_buffer_m=30.0, overwrite=None, verbose=None, quiet=None, superquiet=None)
Example:
tools = Tools()
tools.r_dem_screen(dod="name", output="name")
This grass.tools API is experimental in version 8.5 and expected to be stable in version 8.6.
grass.script.run_command("r.dem.screen", dod, spectral_change=None, output, topo_threshold=1.0, spectral_threshold=-0.15, infrastructure=None, hazard_output=None, infra_buffer_m=30.0, overwrite=None, verbose=None, quiet=None, superquiet=None)
Example:
gs.run_command("r.dem.screen", dod="name", output="name")
Parameters
dod=name [required]
DEM of Difference raster (significant change only, 10 m)
spectral_change=name
Spectral change raster (NDVI or VARI; negative = vegetation loss)
output=name [required]
Output triage raster (0-3 priority classes)
topo_threshold=float
|DoD| threshold (m) above which topographic change is flagged
Default: 1.0
spectral_threshold=float
Spectral change threshold below which vegetation loss is flagged
Default: -0.15
infrastructure=name
Infrastructure vector (roads, rail, utilities) for hazard overlay
Or data source for direct OGR access
hazard_output=name
Output hazard priority raster (requires infrastructure input)
infra_buffer_m=float
Buffer distance (m) around infrastructure for hazard intersection
Default: 30.0
--overwrite
Allow output files to overwrite existing files
--help
Print usage summary
--verbose
Verbose module output
--quiet
Quiet module output
--qq
Very quiet module output
--ui
Force launching GUI dialog
dod : str | np.ndarray, required
DEM of Difference raster (significant change only, 10 m)
Used as: input, raster, name
spectral_change : str | np.ndarray, optional
Spectral change raster (NDVI or VARI; negative = vegetation loss)
Used as: input, raster, name
output : str | type(np.ndarray) | type(np.array) | type(gs.array.array), required
Output triage raster (0-3 priority classes)
Used as: output, raster, name
topo_threshold : float, optional
|DoD| threshold (m) above which topographic change is flagged
Default: 1.0
spectral_threshold : float, optional
Spectral change threshold below which vegetation loss is flagged
Default: -0.15
infrastructure : str, optional
Infrastructure vector (roads, rail, utilities) for hazard overlay
Or data source for direct OGR access
Used as: input, vector, name
hazard_output : str | type(np.ndarray) | type(np.array) | type(gs.array.array), optional
Output hazard priority raster (requires infrastructure input)
Used as: output, raster, name
infra_buffer_m : float, optional
Buffer distance (m) around infrastructure for hazard intersection
Default: 30.0
overwrite : bool, optional
Allow output files to overwrite existing files
Default: None
verbose : bool, optional
Verbose module output
Default: None
quiet : bool, optional
Quiet module output
Default: None
superquiet : bool, optional
Very quiet module output
Default: None
Returns:
result : grass.tools.support.ToolResult | np.ndarray | tuple[np.ndarray] | None
If the tool produces text as standard output, a ToolResult object will be returned. Otherwise, None will be returned. If an array type (e.g., np.ndarray) is used for one of the raster outputs, the result will be an array and will have the shape corresponding to the computational region. If an array type is used for more than one raster output, the result will be a tuple of arrays.
Raises:
grass.tools.ToolError: When the tool ended with an error.
dod : str, required
DEM of Difference raster (significant change only, 10 m)
Used as: input, raster, name
spectral_change : str, optional
Spectral change raster (NDVI or VARI; negative = vegetation loss)
Used as: input, raster, name
output : str, required
Output triage raster (0-3 priority classes)
Used as: output, raster, name
topo_threshold : float, optional
|DoD| threshold (m) above which topographic change is flagged
Default: 1.0
spectral_threshold : float, optional
Spectral change threshold below which vegetation loss is flagged
Default: -0.15
infrastructure : str, optional
Infrastructure vector (roads, rail, utilities) for hazard overlay
Or data source for direct OGR access
Used as: input, vector, name
hazard_output : str, optional
Output hazard priority raster (requires infrastructure input)
Used as: output, raster, name
infra_buffer_m : float, optional
Buffer distance (m) around infrastructure for hazard intersection
Default: 30.0
overwrite : bool, optional
Allow output files to overwrite existing files
Default: None
verbose : bool, optional
Verbose module output
Default: None
quiet : bool, optional
Quiet module output
Default: None
superquiet : bool, optional
Very quiet module output
Default: None
DESCRIPTION
r.dem.screen performs a rapid regional triage that fuses topographic change (from a DEM of Difference) with optional spectral change (NDVI or VARI), and can overlay the result with infrastructure to flag hazard hotspots. It is intended as a coarse-resolution first pass that directs detailed analysis toward the highest-priority areas.
Triage
The output raster classifies each cell into a priority class. With a spectral_change raster supplied:
| Class | Meaning |
|---|---|
| 0 | No significant change |
| 1 | Spectral change only (vegetation damage) |
| 2 | Topographic change only (geomorphic) |
| 3 | Topographic and spectral change (highest priority) |
A cell is flagged for topographic change when |dod| >= topo_threshold, and for
spectral change when spectral_change <= spectral_threshold (negative values
indicate vegetation loss). Without a spectral input only topographic change is
classified (classes 0 and 2).
Hazard overlay
When both an infrastructure vector and a hazard_output name are given, the infrastructure is buffered by infra_buffer_m and intersected with the triage result:
| Class | Meaning |
|---|---|
| 0 | No change and no infrastructure |
| 1 | Infrastructure, no change detected |
| 2 | Change detected, no infrastructure |
| 3 | CRITICAL: change intersects infrastructure |
NOTES
The tool reports per-class cell counts and areas. Both outputs carry category labels. Run the tool at the regional screening resolution (for example 10 m); the dod input is expected to be a significant-change raster, such as the significant DoD from r.dem.change.
EXAMPLES
The commands below use the example scene built in the r.dem toolset manual, which is derived from the North Carolina sample dataset. Build it there first.
Screening runs on a coarser grid than the change analysis: the point is to find where to look, not to measure what happened. At 10 m this tile is only 70 by 75 cells, which is why the triage map looks blocky next to the 1 m products. In practice the screening pass covers a whole flight corridor, where that cell size is far below map scale.
g.region raster=elev_lid792_1m res=10 -a
r.resamp.stats input=dod_significant output=dod_10m_masked method=average

# Blocks holding no significant cell come back NULL, which for screening
# means no change rather than no data.
r.mapcalc "dod_10m = if(isnull(dod_10m_masked), 0, dod_10m_masked)"

r.dem.screen dod=dod_10m output=triage topo_threshold=1.0
Add the road network to flag change that reaches infrastructure:
r.dem.screen dod=dod_10m output=triage \
    infrastructure=pgcp_roads hazard_output=hazard \
    infra_buffer_m=30 topo_threshold=1.0
Adding spectral change
spectral_change fuses vegetation loss with the topographic signal, so that scour under stripped canopy ranks above either signal alone. It expects a bitemporal difference (e.g., NDVI or VARI), negative where vegetation was lost.
However, the North Carolina sample dataset carries only one date of imagery, so a real bitemporal difference cannot be built from it. The raster below is a stand-in: a genuine pre-event NDVI from the Landsat bands, reduced along the flood corridor and perturbed with noise. It illustrates the option, it does not demonstrate that the fusion works, because the vegetation loss is imposed rather than observed. With real imagery, difference the two dates instead.
r.mapcalc "ndvi_pre = float(lsat7_2002_40 - lsat7_2002_30) \
    / float(lsat7_2002_40 + lsat7_2002_30)"

r.surf.gauss output=ndvi_noise mean=0 sigma=0.05 seed=7
r.mapcalc "ndvi_post = ndvi_pre \
    - if(abs(change_truth) > 0.3, 0.30, 0) + ndvi_noise"
r.mapcalc "ndvi_change = ndvi_post - ndvi_pre"

r.dem.screen dod=dod_10m spectral_change=ndvi_change \
    output=triage_fused topo_threshold=1.0 spectral_threshold=-0.15
Reset the region afterwards, since the screening step coarsened it:
g.region raster=elev_lid792_1m
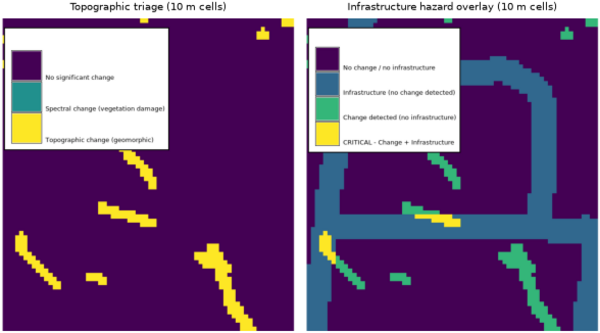
Figure: Topographic triage and the infrastructure hazard overlay, from the
topographic signal alone. The screening grid is deliberately coarse: 10 m
cells, so only 70 by 75 of them cover this tile.
SEE ALSO
r.dem, r.dem.change, r.dem.errprop, v.buffer, v.to.rast
AUTHORS
Corey T. White, Center for Geospatial Analytics, NC State University
SOURCE CODE
Available at: r.dem.screen source code
(history)
Latest change: Thursday Aug 20 19:32:37 2026 in commit d08d385