r.cpt2grass
Convert or apply a GMT color table to a GRASS raster map
r.cpt2grass [-s] [input=name] [url=string] [map=name] [output=name] [--overwrite] [--verbose] [--quiet] [--qq] [--ui]
Example:
r.cpt2grass input=name
grass.tools.Tools.r_cpt2grass(input=None, url=None, map=None, output=None, flags=None, overwrite=None, verbose=None, quiet=None, superquiet=None)
Example:
tools = Tools()
tools.r_cpt2grass(input="name")
This grass.tools API is experimental in version 8.5 and expected to be stable in version 8.6.
grass.script.run_command("r.cpt2grass", input=None, url=None, map=None, output=None, flags=None, overwrite=None, verbose=None, quiet=None, superquiet=None)
Example:
gs.run_command("r.cpt2grass", input="name")
Parameters
input=name
Name of input GMT color table (.cpt file)
url=string
URL of the color table
map=name
Raster map to apply it to
output=name
Name for new rules file
-s
Stretch color scale to match map data extent
--overwrite
Allow output files to overwrite existing files
--help
Print usage summary
--verbose
Verbose module output
--quiet
Quiet module output
--qq
Very quiet module output
--ui
Force launching GUI dialog
input : str | io.StringIO, optional
Name of input GMT color table (.cpt file)
Used as: input, file, name
url : str, optional
URL of the color table
map : str | np.ndarray, optional
Raster map to apply it to
Used as: input, raster, name
output : str, optional
Name for new rules file
Used as: output, file, name
flags : str, optional
Allowed values: s
s
Stretch color scale to match map data extent
overwrite : bool, optional
Allow output files to overwrite existing files
Default: None
verbose : bool, optional
Verbose module output
Default: None
quiet : bool, optional
Quiet module output
Default: None
superquiet : bool, optional
Very quiet module output
Default: None
Returns:
result : grass.tools.support.ToolResult | None
If the tool produces text as standard output, a ToolResult object will be returned. Otherwise, None will be returned.
Raises:
grass.tools.ToolError: When the tool ended with an error.
input : str, optional
Name of input GMT color table (.cpt file)
Used as: input, file, name
url : str, optional
URL of the color table
map : str, optional
Raster map to apply it to
Used as: input, raster, name
output : str, optional
Name for new rules file
Used as: output, file, name
flags : str, optional
Allowed values: s
s
Stretch color scale to match map data extent
overwrite : bool, optional
Allow output files to overwrite existing files
Default: None
verbose : bool, optional
Verbose module output
Default: None
quiet : bool, optional
Quiet module output
Default: None
superquiet : bool, optional
Very quiet module output
Default: None
DESCRIPTION
Module r.cpt2grass converts GMT color palette (*.cpt) format to GRASS color table format and assigns it to a given raster map. Input can be either cpt file given in input option or a URL of the cpt file specified in url option. Specifying URL is particularly useful when using color tables from cpt-city, because many color tables can be quickly tested without downloading the files. When option map is specified r.cpt2grass assigns the color rules to the given raster map. Depending on the values of the original cpt file, it may be advantageous to use the -s to stretch the colors based on the range of values of the map.
NOTES
RGB and HSV models are supported. The expected format of the cpt file is:
# COLOR_MODEL = RGB
value1 R G B value2 R G B
value2 R G B value3 R G B
...
Named colors are not supported.
EXAMPLES
From cpt-city we download a rainfall color table and convert it to GRASS color table. If we don't specify output file, it is printed to standard output:
r.cpt2grass input=rainfall.cpt
0.000 229:180:44
20.000 229:180:44
20.000 242:180:100
40.000 242:180:100
40.000 243:233:119
60.000 243:233:119
60.000 145:206:126
80.000 145:206:126
80.000 67:190:135
100.000 67:190:135
100.000 52:180:133
120.000 52:180:133
120.000 6:155:66
140.000 6:155:66
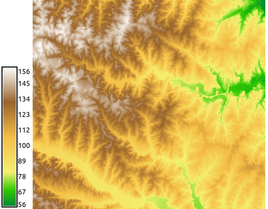
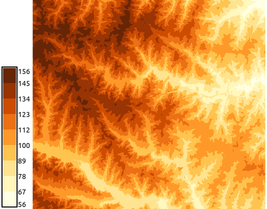
We set two different elevation color tables - continuous and discrete gradients. We have to stretch the color tables to fit the raster map range:
r.cpt2grass url=http://soliton.vm.bytemark.co.uk/pub/cpt-city/td/DEM_screen.cpt map=elevation -s
r.cpt2grass url=http://soliton.vm.bytemark.co.uk/pub/cpt-city/cb/seq/YlOrBr_09.cpt map=elevation -s
We can display legend:
d.legend raster=elevation labelnum=10 at=5,50,7,10
SEE ALSO
AUTHORS
Anna Petrasova, NCSU OSGeoREL
Hamish Bowman (original Bash script)
SOURCE CODE
Available at: r.cpt2grass source code
(history)
Latest change: Wednesday Mar 11 08:17:30 2026 in commit 2a14bbb