v.surf.tps
Performs thin plate spline interpolation with regularization and covariables.
v.surf.tps [-c] input=name [layer=string] [column=name] [smooth=float] [overlap=float] [min=float] [covars=name [,name,...]] [thin=float] output=name [mask=name] [memory=integer] [--overwrite] [--verbose] [--quiet] [--qq] [--ui]
Example:
v.surf.tps input=name output=name
grass.tools.Tools.v_surf_tps(input, layer="1", column=None, smooth=0, overlap=0.1, min=20, covars=None, thin=1.5, output, mask=None, memory=300, flags=None, overwrite=None, verbose=None, quiet=None, superquiet=None)
Example:
tools = Tools()
tools.v_surf_tps(input="name", output="name")
This grass.tools API is experimental in version 8.5 and expected to be stable in version 8.6.
grass.script.run_command("v.surf.tps", input, layer="1", column=None, smooth=0, overlap=0.1, min=20, covars=None, thin=1.5, output, mask=None, memory=300, flags=None, overwrite=None, verbose=None, quiet=None, superquiet=None)
Example:
gs.run_command("v.surf.tps", input="name", output="name")
Parameters
input=name [required]
Name of input vector point map
Or data source for direct OGR access
layer=string
Layer number or name
Vector features can have category values in different layers. This number determines which layer to use. When used with direct OGR access this is the layer name.
Default: 1
column=name
Name of the attribute column with values to be used for interpolation
If not given, z-coordinates are used.
smooth=float
Smoothing factor
Default: 0
overlap=float
Overlap factor <= 1
A larger value increase the tile overlap
Default: 0.1
min=float
Minimum number of points to use for TPS interpolation
Default: 20
covars=name [,name,...]
Name of input raster map(s) to use as covariables
Name of input raster map(s)
thin=float
Point cloud thinning factor in number of cells of the current region
Minimum distance between neighboring points for local TPS interpolation
Default: 1.5
output=name [required]
Name for output raster map
mask=name
Raster map to use for masking
Only cells that are not NULL and not zero are interpolated
memory=integer
Memory in MB
Default: 300
-c
Input points are dense clusters separated by empty areas
--overwrite
Allow output files to overwrite existing files
--help
Print usage summary
--verbose
Verbose module output
--quiet
Quiet module output
--qq
Very quiet module output
--ui
Force launching GUI dialog
input : str, required
Name of input vector point map
Or data source for direct OGR access
Used as: input, vector, name
layer : str, optional
Layer number or name
Vector features can have category values in different layers. This number determines which layer to use. When used with direct OGR access this is the layer name.
Used as: input, layer
Default: 1
column : str, optional
Name of the attribute column with values to be used for interpolation
If not given, z-coordinates are used.
Used as: input, dbcolumn, name
smooth : float, optional
Smoothing factor
Default: 0
overlap : float, optional
Overlap factor <= 1
A larger value increase the tile overlap
Default: 0.1
min : float, optional
Minimum number of points to use for TPS interpolation
Default: 20
covars : str | list[str], optional
Name of input raster map(s) to use as covariables
Name of input raster map(s)
Used as: input, raster, name
thin : float, optional
Point cloud thinning factor in number of cells of the current region
Minimum distance between neighboring points for local TPS interpolation
Default: 1.5
output : str | type(np.ndarray) | type(np.array) | type(gs.array.array), required
Name for output raster map
Used as: output, raster, name
mask : str | np.ndarray, optional
Raster map to use for masking
Only cells that are not NULL and not zero are interpolated
Used as: input, raster, name
memory : int, optional
Memory in MB
Default: 300
flags : str, optional
Allowed values: c
c
Input points are dense clusters separated by empty areas
overwrite : bool, optional
Allow output files to overwrite existing files
Default: None
verbose : bool, optional
Verbose module output
Default: None
quiet : bool, optional
Quiet module output
Default: None
superquiet : bool, optional
Very quiet module output
Default: None
Returns:
result : grass.tools.support.ToolResult | np.ndarray | tuple[np.ndarray] | None
If the tool produces text as standard output, a ToolResult object will be returned. Otherwise, None will be returned. If an array type (e.g., np.ndarray) is used for one of the raster outputs, the result will be an array and will have the shape corresponding to the computational region. If an array type is used for more than one raster output, the result will be a tuple of arrays.
Raises:
grass.tools.ToolError: When the tool ended with an error.
input : str, required
Name of input vector point map
Or data source for direct OGR access
Used as: input, vector, name
layer : str, optional
Layer number or name
Vector features can have category values in different layers. This number determines which layer to use. When used with direct OGR access this is the layer name.
Used as: input, layer
Default: 1
column : str, optional
Name of the attribute column with values to be used for interpolation
If not given, z-coordinates are used.
Used as: input, dbcolumn, name
smooth : float, optional
Smoothing factor
Default: 0
overlap : float, optional
Overlap factor <= 1
A larger value increase the tile overlap
Default: 0.1
min : float, optional
Minimum number of points to use for TPS interpolation
Default: 20
covars : str | list[str], optional
Name of input raster map(s) to use as covariables
Name of input raster map(s)
Used as: input, raster, name
thin : float, optional
Point cloud thinning factor in number of cells of the current region
Minimum distance between neighboring points for local TPS interpolation
Default: 1.5
output : str, required
Name for output raster map
Used as: output, raster, name
mask : str, optional
Raster map to use for masking
Only cells that are not NULL and not zero are interpolated
Used as: input, raster, name
memory : int, optional
Memory in MB
Default: 300
flags : str, optional
Allowed values: c
c
Input points are dense clusters separated by empty areas
overwrite : bool, optional
Allow output files to overwrite existing files
Default: None
verbose : bool, optional
Verbose module output
Default: None
quiet : bool, optional
Quiet module output
Default: None
superquiet : bool, optional
Very quiet module output
Default: None
DESCRIPTION
v.surf.tps performs multivariate thin plate spline interpolation with regularization. The input is a 2D or 3D vector points map. Values to interpolate can be the z values of 3D points or the values in a user-specified attribute column in a 2D or 3D vector map. Output is a raster map. Optionally, several raster maps can be specified to be used as covariables which will improve results in areas with few points. The module can be regarded as a combination of a multiple regression and spline interpolation.
The min options specifies the minimum number of points to be used for interpolation. If the number of input points is smaller than or equal to the minimum number of points, global TPS interpolation is used. If the number of input points is larger than the minimum number of points, tiled local TPS interpolation is used. Tile sizes are variable and dependent on the extents of the min nearest neighbors when a new tile is generated.
The smooth option can be used to reduce the influence of the splines and increase the influence of the covariables. Without covariables, the resulting surface will be smoother. With covariables and a large smooting value, the resulting surface will be mainly determined by the multiple regression component.
The overlap option controls how much tiles are overlapping when the min option is smaller than the numer of input points. Tiling artefacts occur with low values for the min option and the overlap option. Increasing both options will reduce tiling artefacts but processing will take more time. Values for the overlap option must be between 0 and 1.
The module works best with evenly spaced sparse points. In case of highly unevenly spaced points, e.g. remote sensing data with gaps due to cloud cover, the thin option should be used in order to avoid tiling artefacts, otherwise a high number of minimum points and a large overlap value are required, slowing down the module.
The memory option controls only how much memory should be used for the covariables and the intermediate output. The input points are always completely loaded to memory.
EXAMPLES
The computational region setting for the following examples:
g.region -p rast=elev_state_500m
Basic interpolation
Interpolation of 30 year precipitation normals in the North Carlolina sample dataset:
v.surf.tps input=precip_30ynormals_3d output=precip_30ynormals_3d \
           column=annual min=140
Interpolation with a covariable
v.surf.tps input=precip_30ynormals_3d output=precip_30ynormals_3d \
           column=annual min=140 covars=elev_state_500m
Interpolation with a covariable and smoothing
v.surf.tps input=precip_30ynormals_3d output=precip_30ynormals_3d \
           column=annual min=140 covars=elev_state_500m smooth=0.1
Tiled interpolation with a covariable and smoothing
v.surf.tps input=precip_30ynormals_3d output=precip_30ynormals_3d \
           column=annual min=20 covars=elev_state_500m smooth=0.1 \
           overlap=0.1
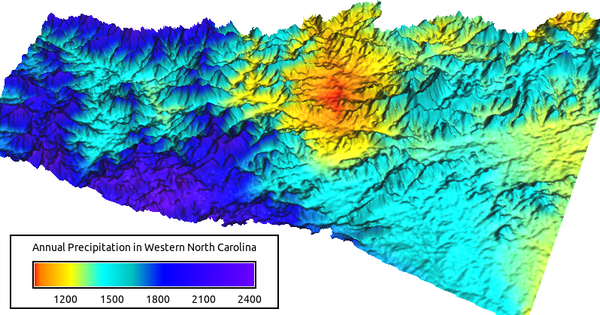
Precipitation computed based on annual normals and elevation as a covariable
REFERENCES
- Hutchinson MF, 1995, Interpolating mean rainfall using thin plate smoothing splines. International Journal of Geographical Information Systems, 9(4), pp. 385-403
- Wahba G, 1990, Spline models for observational data. In CBMS-NSF Regional Conference Series in Applied Mathematics. Philadelpia: Society for Industrial and Applied Mathematics
SEE ALSO
v.surf.rst, v.surf.rst, v.surf.idw
AUTHOR
Markus Metz
SOURCE CODE
Available at: v.surf.tps source code
(history)
Latest change: Thursday Mar 12 20:25:38 2026 in commit f4d3298