v.net.visibility
Performs visibility graph construction.
v.net.visibility input=name output=name [coordinates=east,north] [visibility=name] [--overwrite] [--verbose] [--quiet] [--qq] [--ui]
Example:
v.net.visibility input=name output=name
grass.tools.Tools.v_net_visibility(input, output, coordinates=None, visibility=None, overwrite=None, verbose=None, quiet=None, superquiet=None)
Example:
tools = Tools()
tools.v_net_visibility(input="name", output="name")
This grass.tools API is experimental in version 8.5 and expected to be stable in version 8.6.
grass.script.run_command("v.net.visibility", input, output, coordinates=None, visibility=None, overwrite=None, verbose=None, quiet=None, superquiet=None)
Example:
gs.run_command("v.net.visibility", input="name", output="name")
Parameters
input=name [required]
Name of input vector map
Or data source for direct OGR access
output=name [required]
Name for output vector map
coordinates=east,north
Coordinates
visibility=name
Name of input vector map containing visible points
Add points after computing the visibility graph
--overwrite
Allow output files to overwrite existing files
--help
Print usage summary
--verbose
Verbose module output
--quiet
Quiet module output
--qq
Very quiet module output
--ui
Force launching GUI dialog
input : str, required
Name of input vector map
Or data source for direct OGR access
Used as: input, vector, name
output : str, required
Name for output vector map
Used as: output, vector, name
coordinates : tuple[float, float] | list[float] | str, optional
Coordinates
Used as: input, coords, east,north
visibility : str, optional
Name of input vector map containing visible points
Add points after computing the visibility graph
Used as: input, vector, name
overwrite : bool, optional
Allow output files to overwrite existing files
Default: None
verbose : bool, optional
Verbose module output
Default: None
quiet : bool, optional
Quiet module output
Default: None
superquiet : bool, optional
Very quiet module output
Default: None
Returns:
result : grass.tools.support.ToolResult | None
If the tool produces text as standard output, a ToolResult object will be returned. Otherwise, None will be returned.
Raises:
grass.tools.ToolError: When the tool ended with an error.
input : str, required
Name of input vector map
Or data source for direct OGR access
Used as: input, vector, name
output : str, required
Name for output vector map
Used as: output, vector, name
coordinates : tuple[float, float] | list[float] | str, optional
Coordinates
Used as: input, coords, east,north
visibility : str, optional
Name of input vector map containing visible points
Add points after computing the visibility graph
Used as: input, vector, name
overwrite : bool, optional
Allow output files to overwrite existing files
Default: None
verbose : bool, optional
Verbose module output
Default: None
quiet : bool, optional
Quiet module output
Default: None
superquiet : bool, optional
Very quiet module output
Default: None
DESCRIPTION
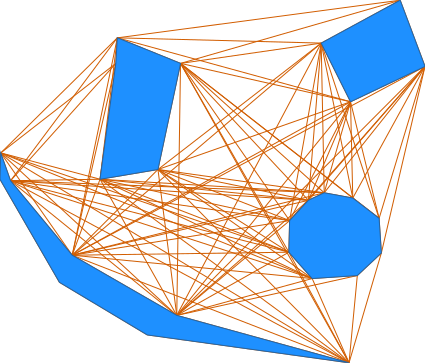
v.net.visibility computes the visibility graph of a vector map containing lines, areas (boundaries) and points. The visibility graph is the graph where the nodes are the end point of the lines, boundaries or simply points. There is an edge between two nodes if they are 'visible' to each other. Two nodes are visibible if there are no segments in between of them, i.e. the edge does not intersect any line or boundary in the vector map. This is useful to compute the shortest path in a vector map from any two points. To do this, first you need to compute the visibility graph and from that to compute the shortest path using v.net.path or d.path.
IMPORTANT: the algorithm doesn't work well with intersecting lines (that includes overlapping)
NOTES
If you compute a shortest path after computing the visibility graph you will notice that this path might go through a vertex of a line. If this is not what you wanted you might need to process the map in v.buffer, initially with a small value. Example:
v.buffer input=map output=bufferedmap buffer=1 type=point,line,area,boundary
The first argument is the input map. It supports lines, boundaries (so,
areas) and points. For the algorithm was written to work with lines and
boundaries not intersecting each other (that includes overlapping).
The resulting map containing the visibility graph is given in the output
map.
If you need to add additional points to compute a shortest path between them afterwards you can use the coordinates parameter, e.g.:
coordinates=25556200,6686400,25556400,6686600
where 25556200,6686400 are the coordinate of the first point and 25556400,6686600 are the coordinates of the second point. Of course you can give as many points as you need. They will be added to the visibility graph and edges from them will be computed. You can always add those points after computing the visibility graph. Simply use the visibility parameter. The input will be the original vector map, the vis will be the computed visibility graph and the output the new visibility graph which will be the vis + the new points given with coordinate (edges will be computed as well).
v.net.visibility input=map visibility=vis_map output=new_vis_map \
      coordinates=25556200,6686400,25556400,6686600
EXAMPLES
Example 1
A simple example (North Carolina sample data) showing how to use the module:
v.extract input=zipcodes_wake output=areas_7_11_25 cats=7,11,25
g.region vector=zipcodes_wake
d.mon wx0
d.vect areas_7_11_25
v.net.visibility input=areas_7_11_25 output=graph
d.vect graph
d.vect areas_7_11_25 color=red type=boundary
Example 2
An example on how to use v.buffer along with the module:
v.buffer input=lines output=buffered_lines buffer=1
v.net.visibility input=buffered_lines output=graph
d.vect graph
d.vect lines col=red
Example 3
An example on how to use the coordinate parameter. This will compute the visibility graph of the vector map lines with the point 2555678,6686343:
v.net.visibility input=lines output=graph coordinates=2555678,6686343
d.vect graph
d.vect lines col=red
Example 4
An example (North Carolina sample data) on how to use the coordinate parameter with the vis parameter. Here the vector map graph is computed then a new visibility graph is computed from it with the point 669547.97,208348.20 extra:
v.extract input=zipcodes_wake output=areas_7_11_25 cats=7,11,25
g.region vector=zipcodes_wake
d.mon wx0
d.vect areas_7_11_25
v.net.visibility input=areas_7_11_25 output=graph
v.net.visibility input=areas_7_11_25 visibility=graph output=new_graph \
      coordinates=669547.97,208348.20
d.erase
d.vect areas_7_11_25
echo "symbol basic/star 20 669547.97 208348.20 black red" | d.graph -m
d.vect new_graph
d.vect areas_7_11_25 color=red type=boundary
Example 5
An example for connections of points (Spearfish):
v.net.visibility input=archsites output=graph
g.region vector=archsites
d.mon wx0
d.vect graph
d.vect archsites col=red
Example 6
Here is an example with artificial data.
Load data using here document syntax (Bash and unix-like commands lines only):
v.in.ascii input=- output=simple format=standard <<EOF
VERTI:
B  6
 82.19908257  75.21788991
 81.67889908  71.40321101
 83.58623853  71.72522936
 84.3293578   75.21788991
 82.24862385  76.06009174
 82.19908257  75.21788991
C  1 1
 82.88897401  73.66318782
 1     1
C  1 1
 90.72645705  75.61248675
 1     2
C  1 1
 89.37944702  69.51012912
 1     3
C  1 1
 81.60108979  67.78669725
 1     4
B  5
 89.92752294  73.95458716
 92.37981651  75.11880734
 91.56238532  77.29862385
 88.96146789  75.88669725
 89.92752294  73.95458716
B  10
 88.54036697  70.70963303
 87.92192518  70.04087417
 87.89633028  69.00045872
 88.66460807  68.13372867
 90.15108904  68.23290821
 90.9426344   68.97588202
 90.86880734  70.11513761
 90.00144697  70.78336312
 89.06055046  70.95733945
 88.54036697  70.70963303
B  9
 78.73119266  71.35366972
 80.76238532  68.90137615
 84.20550459  66.91972477
 89.87798165  65.35917431
 83.23494031  66.27685175
 80.34278748  68.00837238
 78.38484005  71.40292009
 78.40917431  72.27018349
 78.73119266  71.35366972
EOF
Compute the graph:
v.net.visibility input=simple output=graph
KNOWN ISSUES
In some cases when 3 points or nodes are collinear, some wrong edges are added. This happens only really rarly and shouldn't be a big problem. When two points have the exact same x coordinate and are visible, some wrong edges are added.
SEE ALSO
d.path, v.net, v.net.alloc, v.net.iso, v.net.salesman, v.net.steiner, v.to.db
AUTHORS
Maximilian Maldacker
Mentor: Wolf Bergenheim
SOURCE CODE
Available at: v.net.visibility source code
(history)
Latest change: Friday Apr 17 01:04:26 2026 in commit 5a31d54