i.cva
Performs Change Vector Analysis (CVA) in two dimensions.
i.cva xaraster=name xbraster=name yaraster=name ybraster=name output=basename [custom_threshold=float] [stat_threshold=float] [--overwrite] [--verbose] [--quiet] [--qq] [--ui]
Example:
i.cva xaraster=name xbraster=name yaraster=name ybraster=name output=basename
grass.tools.Tools.i_cva(xaraster, xbraster, yaraster, ybraster, output, custom_threshold=None, stat_threshold=None, overwrite=None, verbose=None, quiet=None, superquiet=None)
Example:
tools = Tools()
tools.i_cva(xaraster="name", xbraster="name", yaraster="name", ybraster="name", output="basename")
This grass.tools API is experimental in version 8.5 and expected to be stable in version 8.6.
grass.script.run_command("i.cva", xaraster, xbraster, yaraster, ybraster, output, custom_threshold=None, stat_threshold=None, overwrite=None, verbose=None, quiet=None, superquiet=None)
Example:
gs.run_command("i.cva", xaraster="name", xbraster="name", yaraster="name", ybraster="name", output="basename")
Parameters
xaraster=name [required]
Name of the first raster for X axis
xbraster=name [required]
Name of the the second raster for X axis
yaraster=name [required]
Name of the first raster for Y axis
ybraster=name [required]
Name of the second raster for Y axis
output=basename [required]
Name for output basename raster maps (angle and magnitude)
Name for output basename raster map(s)
custom_threshold=float
Use a custom threshold
stat_threshold=float
Use a statystical parameter for the threshold (mean + N * standard deviation)
--overwrite
Allow output files to overwrite existing files
--help
Print usage summary
--verbose
Verbose module output
--quiet
Quiet module output
--qq
Very quiet module output
--ui
Force launching GUI dialog
xaraster : str | np.ndarray, required
Name of the first raster for X axis
Used as: input, raster, name
xbraster : str | np.ndarray, required
Name of the the second raster for X axis
Used as: input, raster, name
yaraster : str | np.ndarray, required
Name of the first raster for Y axis
Used as: input, raster, name
ybraster : str | np.ndarray, required
Name of the second raster for Y axis
Used as: input, raster, name
output : str | type(np.ndarray) | type(np.array) | type(gs.array.array), required
Name for output basename raster maps (angle and magnitude)
Name for output basename raster map(s)
Used as: output, raster, basename
custom_threshold : float, optional
Use a custom threshold
stat_threshold : float, optional
Use a statystical parameter for the threshold (mean + N * standard deviation)
overwrite : bool, optional
Allow output files to overwrite existing files
Default: None
verbose : bool, optional
Verbose module output
Default: None
quiet : bool, optional
Quiet module output
Default: None
superquiet : bool, optional
Very quiet module output
Default: None
Returns:
result : grass.tools.support.ToolResult | np.ndarray | tuple[np.ndarray] | None
If the tool produces text as standard output, a ToolResult object will be returned. Otherwise, None will be returned. If an array type (e.g., np.ndarray) is used for one of the raster outputs, the result will be an array and will have the shape corresponding to the computational region. If an array type is used for more than one raster output, the result will be a tuple of arrays.
Raises:
grass.tools.ToolError: When the tool ended with an error.
xaraster : str, required
Name of the first raster for X axis
Used as: input, raster, name
xbraster : str, required
Name of the the second raster for X axis
Used as: input, raster, name
yaraster : str, required
Name of the first raster for Y axis
Used as: input, raster, name
ybraster : str, required
Name of the second raster for Y axis
Used as: input, raster, name
output : str, required
Name for output basename raster maps (angle and magnitude)
Name for output basename raster map(s)
Used as: output, raster, basename
custom_threshold : float, optional
Use a custom threshold
stat_threshold : float, optional
Use a statystical parameter for the threshold (mean + N * standard deviation)
overwrite : bool, optional
Allow output files to overwrite existing files
Default: None
verbose : bool, optional
Verbose module output
Default: None
quiet : bool, optional
Quiet module output
Default: None
superquiet : bool, optional
Very quiet module output
Default: None
DESCRIPTION
i.cva calculates Change Vector Analysis (CVA) for two input variables.
CVA is a remote sensing technique used for change detection analysis. As
input for CVA, two maps for each date must be given: in general, on X
axis an indicator of overall reflectance and on Y axis an indicator of
vegetation conditions. A common choice for the indicators is Albedo and
NDVI (Normalized Difference Vegetation Index) or the Brightness and
Greenness features features of the Tasselled Cap (TC) transform.
For each pixel of the original image, CVA gives in output a map of the
angle and a map of the magnitude of the vector of the change between two
dates.
Read Malila et al. for a complete explanation of the technique. This
module might require a first transformation of the data to Top Of
Atmosphere Reflectance (TOAR); if the TC transform are chosen as
indicators, the TC transform should be then performed as well before
running CVA.
Four parameters are required in input:
- xaraster: first date map for X axis,
- xbraster: second date map for X axis,
- yaraster: first date map for Y axis,
- ybraster: second date map for Y axis.
The following maps can be generated in output:
- basename_angle: map of the angles of the change vector between the two dates;
- basename_angle_class: map of the angles, classified by the four quadrants (0-90, 90-180, ...);
- basename_magnitude: map of the magnitudes of the change vector between the two dates;
- basename_change: final map of the change
The change detection map is created using the classified angle map and
applying a threshold to the magnitude: the change is given by the pixels
that have values higher than the threshold, divided in four categories
depending on the quadrant they belong to.
The threshold can be chosen manually (custom value, given by personal
criteria) or using statistical criteria. In this case the mean of the
magnitude values is used and the user can choose the multiples of N
standard deviation to sum to the mean (threshold = mean + N * standard
deviation).
One could consider of running the module at first without assigning a
threshold, in order to have an idea of the range of the magnitude and to
choose an appropriate custom threshold (for univariate statistical
parameters run
r.univar).
In this case i.cva gives in output only three maps: the angle, angle
classified and magnitude maps.
EXAMPLE
Calculation of CVA maps from North Carolina Landsat 5 TM and 7 ETM
scenes, using lsat5_1987 and lsat7_2002.
The Tasselled cap maps are calculated for TOAR data.
# compute tasscap of 1987 scene
g.region raster=lsat5_1987_10 -p
i.tasscap sensor=landsat5_tm \
          input=lsat5_1987_10,lsat5_1987_20,lsat5_1987_30,lsat5_1987_40,lsat5_1987_50,lsat5_1987_70 \
          output=lsat5_1987_tasscap

# compute tasscap of 2002 scene
g.region raster=lsat7_2002_10 -p
i.tasscap sensor=landsat7_etm \
          input=lsat7_2002_10,lsat7_2002_20,lsat7_2002_30,lsat7_2002_40,lsat7_2002_50,lsat7_2002_70 \
          output=lsat7_2002_tasscap

# compute CVA
i.cva xaraster=lsat5_1987_tasscap.1 xbraster=lsat7_2002_tasscap.1 \
      yaraster=lsat5_1987_tasscap.2 ybraster=lsat7_2002_tasscap.2 \
      output=CVA_87_02 stat_threshold=1

Calculating DeltaX and DeltaY
Writing angle map CVA_87_02_angle
Writing magnitude map CVA_87_02_magnitude
Mean of magnitude values is: 0.091335330260002
Standard deviation of magnitude values is: 0.0671211630131731
Writing change detection map CVA_87_02_change
Threshold is 0.158456493273
Results:
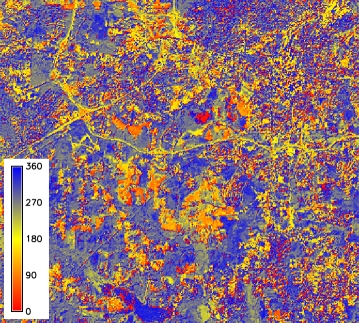
CVA angle map 1.
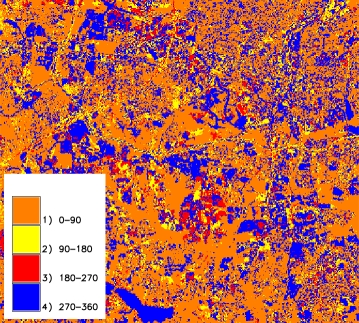
CVA classified angle map.
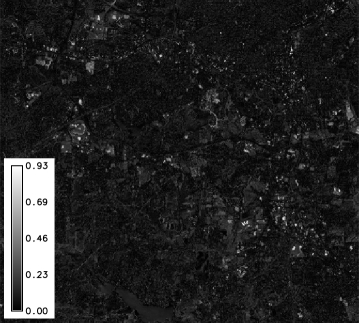
CVA magnitude map.

CVA change map.
Optionally, labels can be added to the four quadrants of the change map (after Zanchetta et al., 2016):
# assign legend
cat i_cva_legend_rules.csv
1:moisture reduction
2:chlorophyll increase
3:moisture increase
4:bare soil increase

r.category map=CVA_87_02_change separator=":" rules=i_cva_legend_rules.csv

# assign colors
cat i_cva_color_rules.csv
1 217:255:0
2 10:214:10
3 75:173:255
4 139:105:20

r.colors map=CVA_87_02_change rules=i_cva_color_rules.csv
REFERENCES
- Malila W A, Lafayette W. Change Vector Analysis (1980): An Approach for Detecting Forest Changes with Landsat. LARS Symp., pp. 326-335 (PDF)
- Zanchetta, A., Bitelli, G. & Karnieli, A. (2016): Monitoring desertification by remote sensing using the Tasselled Cap transform for long-term change detection. Nat Hazards, 83(Suppl 1):223-237. (DOI)
SEE ALSO
i.albedo, i.vi, i.aster.toar, i.landsat.toar, r.univar
AUTHOR
Anna Zanchetta
SOURCE CODE
Available at: i.cva source code
(history)
Latest change: Thursday Mar 05 14:47:35 2026 in commit 4c42dd0