r.barplot
Draws a barplot or piechart of a statistic per category of a zonal raster.
r.barplot [-hgnc] zones=name [map=name] statistic=string [unit=string] [output=name] [plot_dimensions=string] [dpi=integer] [order=string] [rotate_labels=float] [title=string] [y_label=string] [x_label=string] [fontsize=integer] [title_fontsize=integer] [font=string] [style=string] plot_type=string [color=name] [border_color=name] [border_width=float] [nprocs=integer] [--overwrite] [--verbose] [--quiet] [--qq] [--ui]
Example:
r.barplot zones=name statistic=count plot_type=bar
grass.tools.Tools.r_barplot(zones, map=None, statistic="count", unit="cells", output=None, plot_dimensions=None, dpi=None, order=None, rotate_labels=None, title=None, y_label=None, x_label=None, fontsize=10, title_fontsize=None, font=None, style=None, plot_type="bar", color="", border_color="", border_width=None, nprocs=0, flags=None, overwrite=None, verbose=None, quiet=None, superquiet=None)
Example:
tools = Tools()
tools.r_barplot(zones="name", statistic="count", plot_type="bar")
This grass.tools API is experimental in version 8.5 and expected to be stable in version 8.6.
grass.script.run_command("r.barplot", zones, map=None, statistic="count", unit="cells", output=None, plot_dimensions=None, dpi=None, order=None, rotate_labels=None, title=None, y_label=None, x_label=None, fontsize=10, title_fontsize=None, font=None, style=None, plot_type="bar", color="", border_color="", border_width=None, nprocs=0, flags=None, overwrite=None, verbose=None, quiet=None, superquiet=None)
Example:
gs.run_command("r.barplot", zones="name", statistic="count", plot_type="bar")
Parameters
zones=name [required]
Zonal raster
Categorical (CELL) raster with the zones to summarize.
map=name
Value raster
Value raster to summarize per zone. Required for sum, mean, minimum and maximum.
statistic=string [required]
Statistic
Statistic to compute for each zone.
Allowed values: count, sum, mean, minimum, maximum
Default: count
unit=string
Unit (count only)
Reporting unit when statistic=count.
Allowed values: cells, percent, m2, ha, km2
Default: cells
output=name
Name of output image file
Name for output file
plot_dimensions=string
Plot dimensions (width,height)
Dimensions (width,height) of the figure in inches.
dpi=integer
DPI
Resolution of the plot in dots per inch.
order=string
Sort order
Sort the bars/wedges by value.
Allowed values: ascending, descending
rotate_labels=float
Rotate labels (degrees)
Rotate the category labels (barplot only).
Allowed values: -90-90
title=string
Plot title
Optional title above the plot.
y_label=string
Value axis label
Label of the value axis (barplot). Defaults to the statistic.
x_label=string
Category axis label
Label of the category axis (barplot).
fontsize=integer
Font size
Base font size.
Default: 10
title_fontsize=integer
Title font size
Font size of the title. Defaults to the base font size.
font=string
Font family
Font family for all text (e.g. sans-serif, serif, DejaVu Sans).
style=string
Matplotlib style
Matplotlib style sheet, see https://matplotlib.org/stable/gallery/style_sheets/style_sheets_reference.html
Allowed values: _mpl-gallery, _mpl-gallery-nogrid, bmh, classic, dark_background, fast, fivethirtyeight, ggplot, grayscale, seaborn-v0_8, seaborn-v0_8-bright, seaborn-v0_8-colorblind, seaborn-v0_8-dark, seaborn-v0_8-dark-palette, seaborn-v0_8-darkgrid, seaborn-v0_8-deep, seaborn-v0_8-muted, seaborn-v0_8-notebook, seaborn-v0_8-paper, seaborn-v0_8-pastel, seaborn-v0_8-poster, seaborn-v0_8-talk, seaborn-v0_8-ticks, seaborn-v0_8-white, seaborn-v0_8-whitegrid, Solarize_Light2, tableau-colorblind10
plot_type=string [required]
Plot type
Draw a barplot or a piechart.
Allowed values: bar, pie
Default: bar
color=name
Bar/wedge color
Fill color of the bars/wedges. Defaults to the style palette. See manual for color notation.
border_color=name
Border color
Color of the bar/wedge borders. Defaults to the Matplotlib default.
border_width=float
Border width
Line width of the bar/wedge borders. Defaults to the Matplotlib default.
nprocs=integer
Number of threads for parallel computing
0: use OpenMP default; >0: use nprocs; <0: use MAX-nprocs
Default: 0
-h
Horizontal barplot
Draw the bars horizontally (barplot only).
-g
Add grid lines
Add grid lines (barplot only).
-n
Show values
Print the value on top of each bar or in each pie wedge.
-c
Zonal colors
Fill bars/wedges with the colors of the zonal raster categories.
--overwrite
Allow output files to overwrite existing files
--help
Print usage summary
--verbose
Verbose module output
--quiet
Quiet module output
--qq
Very quiet module output
--ui
Force launching GUI dialog
zones : str | np.ndarray, required
Zonal raster
Categorical (CELL) raster with the zones to summarize.
Used as: input, raster, name
map : str | np.ndarray, optional
Value raster
Value raster to summarize per zone. Required for sum, mean, minimum and maximum.
Used as: input, raster, name
statistic : str, required
Statistic
Statistic to compute for each zone.
Allowed values: count, sum, mean, minimum, maximum
Default: count
unit : str, optional
Unit (count only)
Reporting unit when statistic=count.
Allowed values: cells, percent, m2, ha, km2
Default: cells
output : str, optional
Name of output image file
Name for output file
Used as: output, file, name
plot_dimensions : str, optional
Plot dimensions (width,height)
Dimensions (width,height) of the figure in inches.
dpi : int, optional
DPI
Resolution of the plot in dots per inch.
order : str, optional
Sort order
Sort the bars/wedges by value.
Allowed values: ascending, descending
rotate_labels : float, optional
Rotate labels (degrees)
Rotate the category labels (barplot only).
Allowed values: -90-90
title : str, optional
Plot title
Optional title above the plot.
y_label : str, optional
Value axis label
Label of the value axis (barplot). Defaults to the statistic.
x_label : str, optional
Category axis label
Label of the category axis (barplot).
fontsize : int, optional
Font size
Base font size.
Default: 10
title_fontsize : int, optional
Title font size
Font size of the title. Defaults to the base font size.
font : str, optional
Font family
Font family for all text (e.g. sans-serif, serif, DejaVu Sans).
style : str, optional
Matplotlib style
Matplotlib style sheet, see https://matplotlib.org/stable/gallery/style_sheets/style_sheets_reference.html
Allowed values: _mpl-gallery, _mpl-gallery-nogrid, bmh, classic, dark_background, fast, fivethirtyeight, ggplot, grayscale, seaborn-v0_8, seaborn-v0_8-bright, seaborn-v0_8-colorblind, seaborn-v0_8-dark, seaborn-v0_8-dark-palette, seaborn-v0_8-darkgrid, seaborn-v0_8-deep, seaborn-v0_8-muted, seaborn-v0_8-notebook, seaborn-v0_8-paper, seaborn-v0_8-pastel, seaborn-v0_8-poster, seaborn-v0_8-talk, seaborn-v0_8-ticks, seaborn-v0_8-white, seaborn-v0_8-whitegrid, Solarize_Light2, tableau-colorblind10
plot_type : str, required
Plot type
Draw a barplot or a piechart.
Allowed values: bar, pie
Default: bar
color : str, optional
Bar/wedge color
Fill color of the bars/wedges. Defaults to the style palette. See manual for color notation.
Used as: input, color, name
border_color : str, optional
Border color
Color of the bar/wedge borders. Defaults to the Matplotlib default.
Used as: input, color, name
border_width : float, optional
Border width
Line width of the bar/wedge borders. Defaults to the Matplotlib default.
nprocs : int, optional
Number of threads for parallel computing
0: use OpenMP default; >0: use nprocs; <0: use MAX-nprocs
Default: 0
flags : str, optional
Allowed values: h, g, n, c
h
Horizontal barplot
Draw the bars horizontally (barplot only).
g
Add grid lines
Add grid lines (barplot only).
n
Show values
Print the value on top of each bar or in each pie wedge.
c
Zonal colors
Fill bars/wedges with the colors of the zonal raster categories.
overwrite : bool, optional
Allow output files to overwrite existing files
Default: None
verbose : bool, optional
Verbose module output
Default: None
quiet : bool, optional
Quiet module output
Default: None
superquiet : bool, optional
Very quiet module output
Default: None
Returns:
result : grass.tools.support.ToolResult | None
If the tool produces text as standard output, a ToolResult object will be returned. Otherwise, None will be returned.
Raises:
grass.tools.ToolError: When the tool ended with an error.
zones : str, required
Zonal raster
Categorical (CELL) raster with the zones to summarize.
Used as: input, raster, name
map : str, optional
Value raster
Value raster to summarize per zone. Required for sum, mean, minimum and maximum.
Used as: input, raster, name
statistic : str, required
Statistic
Statistic to compute for each zone.
Allowed values: count, sum, mean, minimum, maximum
Default: count
unit : str, optional
Unit (count only)
Reporting unit when statistic=count.
Allowed values: cells, percent, m2, ha, km2
Default: cells
output : str, optional
Name of output image file
Name for output file
Used as: output, file, name
plot_dimensions : str, optional
Plot dimensions (width,height)
Dimensions (width,height) of the figure in inches.
dpi : int, optional
DPI
Resolution of the plot in dots per inch.
order : str, optional
Sort order
Sort the bars/wedges by value.
Allowed values: ascending, descending
rotate_labels : float, optional
Rotate labels (degrees)
Rotate the category labels (barplot only).
Allowed values: -90-90
title : str, optional
Plot title
Optional title above the plot.
y_label : str, optional
Value axis label
Label of the value axis (barplot). Defaults to the statistic.
x_label : str, optional
Category axis label
Label of the category axis (barplot).
fontsize : int, optional
Font size
Base font size.
Default: 10
title_fontsize : int, optional
Title font size
Font size of the title. Defaults to the base font size.
font : str, optional
Font family
Font family for all text (e.g. sans-serif, serif, DejaVu Sans).
style : str, optional
Matplotlib style
Matplotlib style sheet, see https://matplotlib.org/stable/gallery/style_sheets/style_sheets_reference.html
Allowed values: _mpl-gallery, _mpl-gallery-nogrid, bmh, classic, dark_background, fast, fivethirtyeight, ggplot, grayscale, seaborn-v0_8, seaborn-v0_8-bright, seaborn-v0_8-colorblind, seaborn-v0_8-dark, seaborn-v0_8-dark-palette, seaborn-v0_8-darkgrid, seaborn-v0_8-deep, seaborn-v0_8-muted, seaborn-v0_8-notebook, seaborn-v0_8-paper, seaborn-v0_8-pastel, seaborn-v0_8-poster, seaborn-v0_8-talk, seaborn-v0_8-ticks, seaborn-v0_8-white, seaborn-v0_8-whitegrid, Solarize_Light2, tableau-colorblind10
plot_type : str, required
Plot type
Draw a barplot or a piechart.
Allowed values: bar, pie
Default: bar
color : str, optional
Bar/wedge color
Fill color of the bars/wedges. Defaults to the style palette. See manual for color notation.
Used as: input, color, name
border_color : str, optional
Border color
Color of the bar/wedge borders. Defaults to the Matplotlib default.
Used as: input, color, name
border_width : float, optional
Border width
Line width of the bar/wedge borders. Defaults to the Matplotlib default.
nprocs : int, optional
Number of threads for parallel computing
0: use OpenMP default; >0: use nprocs; <0: use MAX-nprocs
Default: 0
flags : str, optional
Allowed values: h, g, n, c
h
Horizontal barplot
Draw the bars horizontally (barplot only).
g
Add grid lines
Add grid lines (barplot only).
n
Show values
Print the value on top of each bar or in each pie wedge.
c
Zonal colors
Fill bars/wedges with the colors of the zonal raster categories.
overwrite : bool, optional
Allow output files to overwrite existing files
Default: None
verbose : bool, optional
Verbose module output
Default: None
quiet : bool, optional
Quiet module output
Default: None
superquiet : bool, optional
Very quiet module output
Default: None
DESCRIPTION
r.barplot draws a barplot or piechart summarizing a zones raster. For each category of the zonal map it computes a statistic and plots one bar or pie wedge per category.
The statistic can be the count of cells, the surface area, or a percentage (see the unit option). If a value raster is given with the map option, the statistic can instead be the sum, mean, minimum or maximum of the value raster per zone. For count, the cells counted are the non-null cells of the value raster within each zone; without a value raster, all cells of the zone are counted.
The unit option applies to statistic=count and sets the reporting unit: cell count (cells), percent of the total, or surface area in m2, ha or km2. Areas are derived from the current region resolution.
Set plot_type=pie to draw a piechart instead of a barplot. A piechart requires non-negative values and is most meaningful for additive statistics (count, area, sum).
By default the bars and wedges are colored with the active Matplotlib style palette. Set a single color to override this, or use the -c flag to color them with the category colors of the zonal map. Border color and width can be set separately.
Layout options include sorting the bars/wedges (order), drawing the barplot horizontally (-h), adding grid lines (-g), rotating the category labels (rotate_labels), and printing the values on the bars or wedges (-n). A title, base fontsize, font family and labels for the value axis (y_label) and category axis (x_label) can be set as well. Axis labels do not apply to a piechart.
The plot can be styled with a Matplotlib style sheet through the style option, e.g. style=ggplot.
By default the plot is shown on screen. If output is given, the plot is written to that file, with the format determined by the file extension (e.g. output=plot.png). The size (plot_dimensions, in inches) and resolution (dpi) of the image can be set.
NOTE
The statistics are computed over the current computational region and respect an active raster mask. Set the region to the zonal map before running the module if needed.
EXAMPLE
The examples use the North Carolina sample dataset.
Example 1
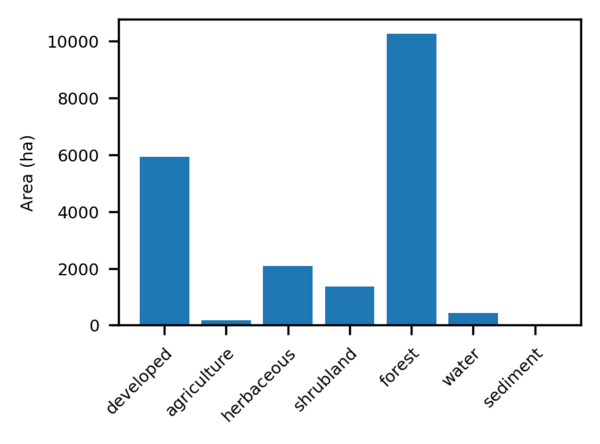
Barplot of the area (in hectares) of each land use category.
g.region raster=landclass96
r.barplot zones=landclass96 statistic=count unit=ha output=r_barplot_01.png rotate_labels=45
Example 2
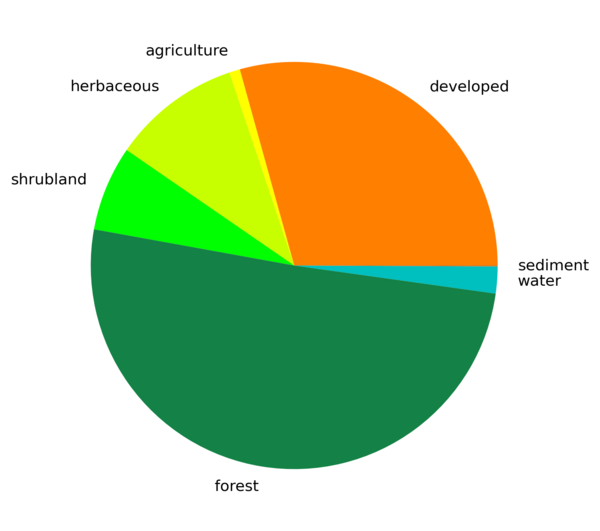
Piechart of the number of cells per land use category, using the colors of the zonal map.
r.barplot -c zones=landclass96 statistic=count plot_type=pie output=r_barplot_02.png
Example 3
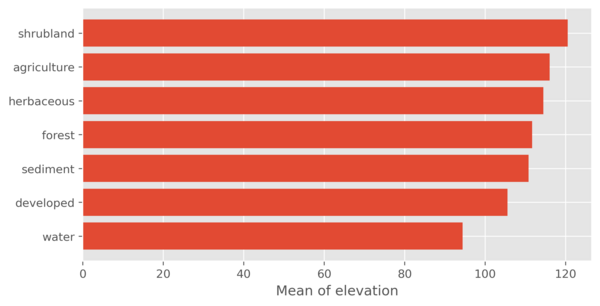
Horizontal barplot of the mean elevation per land use category, sorted in descending order. The style option is used to style the plot to resemble the default ggplot appearance.
r.barplot -h zones=landclass96 map=elevation statistic=mean order=descending style=ggplot output=r_barplot_03.png
SEE ALSO
r.boxplot, v.boxplot,v.scatterplot,v.histogram, r.series.boxplot, r.stats, r.univar
AUTHOR
Paulo van Breugel, HAS green academy, Innovative Biomonitoring research group, Climate-robust Landscapes research group
SOURCE CODE
Available at: r.barplot source code
(history)
Latest change: Tuesday Aug 04 19:36:14 2026 in commit f37aa82