r.in.pdal
Creates a raster map from LAS LiDAR points using univariate statistics and r.in.xyz.
r.in.pdal [-sg] input=name output=name [,name,...] [resolution=float] [raster_reference=string] [raster_file=string] [method=string [,string,...]] [zrange=min,max] [zscale=float] [type=string] [percent=integer] [pth=integer] [trim=float] [footprint=string] [pdal_cmd=string] [--overwrite] [--verbose] [--quiet] [--qq] [--ui]
Example:
r.in.pdal input=name output=name
grass.script.run_command("r.in.pdal", input, output, resolution=1.0, raster_reference=None, raster_file=None, method="mean", zrange=None, zscale=1.0, type="FCELL", percent=100, pth=None, trim=None, footprint=None, pdal_cmd="pdal", flags=None, overwrite=None, verbose=None, quiet=None, superquiet=None)
Example:
gs.run_command("r.in.pdal", input="name", output="name")
grass.tools.Tools.r_in_pdal(input, output, resolution=1.0, raster_reference=None, raster_file=None, method="mean", zrange=None, zscale=1.0, type="FCELL", percent=100, pth=None, trim=None, footprint=None, pdal_cmd="pdal", flags=None, overwrite=None, verbose=None, quiet=None, superquiet=None)
Example:
tools = Tools()
tools.r_in_pdal(input="name", output="name")
This grass.tools API is experimental in version 8.5 and expected to be stable in version 8.6.
Parameters
input=name [required]
LAS input file
output=name [,name,...] [required]
Name for output raster map
resolution=float
2D grid resolution (north-south and east-west)
Default: 1.0
raster_reference=string
Raster map to be used as pixel geometry reference
Raster map to align to, e.g. an orthophoto of the same region
raster_file=string
External raster map to be used as pixel geometry reference
External raster map to align to, e.g. an orthophoto of the same region
method=string [,string,...]
Statistic to use for raster values
Allowed values: n, min, max, range, sum, mean, stddev, variance, coeff_var, median, percentile, skewness, trimmean
Default: mean
n: Number of points in cell
min: Minimum value of point values in cell
max: Maximum value of point values in cell
range: Range of point values in cell
sum: Sum of point values in cell
mean: Mean (average) value of point values in cell
stddev: Standard deviation of point values in cell
variance: Variance of point values in cell
coeff_var: Coefficient of variance of point values in cell
median: Median value of point values in cell
percentile: Pth (nth) percentile of point values in cell
skewness: Skewness of point values in cell
zrange=min,max
Filter range for z data (min,max)
zscale=float
Scale to apply to z data
Default: 1.0
type=string
Type of raster map to be created / Storage type for resultant raster map
Allowed values: CELL, FCELL, DCELL
Default: FCELL
CELL: Integer
FCELL: Single precision floating point
DCELL: Double precision floating point
percent=integer
Percent of map to keep in memory
Allowed values: 1-100
Default: 100
pth=integer
Pth percentile of the values
Allowed values: 1-100
trim=float
Discard <trim> percent of the smallest and <trim> percent of the largest observations
Allowed values: 1-50
footprint=string
Footprint of the data as vector map
pdal_cmd=string
Command for PDAL (e.g. if PDAL runs only in a docker)
Default: pdal
-s
Scan data file for extent then exit
-g
In scan mode, print using shell script style
--overwrite
Allow output files to overwrite existing files
--help
Print usage summary
--verbose
Verbose module output
--quiet
Quiet module output
--qq
Very quiet module output
--ui
Force launching GUI dialog
input : str, required
LAS input file
Used as: input, raster, name
output : str | list[str], required
Name for output raster map
Used as: output, raster, name
resolution : float, optional
2D grid resolution (north-south and east-west)
Default: 1.0
raster_reference : str, optional
Raster map to be used as pixel geometry reference
Raster map to align to, e.g. an orthophoto of the same region
raster_file : str, optional
External raster map to be used as pixel geometry reference
External raster map to align to, e.g. an orthophoto of the same region
method : str | list[str], optional
Statistic to use for raster values
Allowed values: n, min, max, range, sum, mean, stddev, variance, coeff_var, median, percentile, skewness, trimmean
n: Number of points in cell
min: Minimum value of point values in cell
max: Maximum value of point values in cell
range: Range of point values in cell
sum: Sum of point values in cell
mean: Mean (average) value of point values in cell
stddev: Standard deviation of point values in cell
variance: Variance of point values in cell
coeff_var: Coefficient of variance of point values in cell
median: Median value of point values in cell
percentile: Pth (nth) percentile of point values in cell
skewness: Skewness of point values in cell
Default: mean
zrange : tuple[float, float] | list[float] | str, optional
Filter range for z data (min,max)
Used as: min,max
zscale : float, optional
Scale to apply to z data
Default: 1.0
type : str, optional
Type of raster map to be created / Storage type for resultant raster map
Allowed values: CELL, FCELL, DCELL
CELL: Integer
FCELL: Single precision floating point
DCELL: Double precision floating point
Default: FCELL
percent : int, optional
Percent of map to keep in memory
Allowed values: 1-100
Default: 100
pth : int, optional
Pth percentile of the values
Allowed values: 1-100
trim : float, optional
Discard <trim> percent of the smallest and <trim> percent of the largest observations
Allowed values: 1-50
footprint : str, optional
Footprint of the data as vector map
pdal_cmd : str, optional
Command for PDAL (e.g. if PDAL runs only in a docker)
Default: pdal
flags : str, optional
Allowed values: s, g
s
Scan data file for extent then exit
g
In scan mode, print using shell script style
overwrite : bool, optional
Allow output files to overwrite existing files
Default: None
verbose : bool, optional
Verbose module output
Default: None
quiet : bool, optional
Quiet module output
Default: None
superquiet : bool, optional
Very quiet module output
Default: None
input : str | np.ndarray, required
LAS input file
Used as: input, raster, name
output : str | list[str], required
Name for output raster map
Used as: output, raster, name
resolution : float, optional
2D grid resolution (north-south and east-west)
Default: 1.0
raster_reference : str, optional
Raster map to be used as pixel geometry reference
Raster map to align to, e.g. an orthophoto of the same region
raster_file : str, optional
External raster map to be used as pixel geometry reference
External raster map to align to, e.g. an orthophoto of the same region
method : str | list[str], optional
Statistic to use for raster values
Allowed values: n, min, max, range, sum, mean, stddev, variance, coeff_var, median, percentile, skewness, trimmean
n: Number of points in cell
min: Minimum value of point values in cell
max: Maximum value of point values in cell
range: Range of point values in cell
sum: Sum of point values in cell
mean: Mean (average) value of point values in cell
stddev: Standard deviation of point values in cell
variance: Variance of point values in cell
coeff_var: Coefficient of variance of point values in cell
median: Median value of point values in cell
percentile: Pth (nth) percentile of point values in cell
skewness: Skewness of point values in cell
Default: mean
zrange : tuple[float, float] | list[float] | str, optional
Filter range for z data (min,max)
Used as: min,max
zscale : float, optional
Scale to apply to z data
Default: 1.0
type : str, optional
Type of raster map to be created / Storage type for resultant raster map
Allowed values: CELL, FCELL, DCELL
CELL: Integer
FCELL: Single precision floating point
DCELL: Double precision floating point
Default: FCELL
percent : int, optional
Percent of map to keep in memory
Allowed values: 1-100
Default: 100
pth : int, optional
Pth percentile of the values
Allowed values: 1-100
trim : float, optional
Discard <trim> percent of the smallest and <trim> percent of the largest observations
Allowed values: 1-50
footprint : str, optional
Footprint of the data as vector map
pdal_cmd : str, optional
Command for PDAL (e.g. if PDAL runs only in a docker)
Default: pdal
flags : str, optional
Allowed values: s, g
s
Scan data file for extent then exit
g
In scan mode, print using shell script style
overwrite : bool, optional
Allow output files to overwrite existing files
Default: None
verbose : bool, optional
Verbose module output
Default: None
quiet : bool, optional
Quiet module output
Default: None
superquiet : bool, optional
Very quiet module output
Default: None
Returns:
result : grass.tools.support.ToolResult | None
If the tool produces text as standard output, a ToolResult object will be returned. Otherwise, None will be returned.
Raises:
grass.tools.ToolError: When the tool ended with an error.
DESCRIPTION
r.in.pdal creates a raster map from LAS LiDAR points using the Point Data Abstraction Library (PDAL) by binning the points into a raster map using univariate statistics. The user may choose from a variety of statistical methods which will be used for binning when creating the new raster map.
The computational region of a LiDAR point file can be determined by scanning the file using the -s flag.
Optionally r.in.pdal creates an estimated vector footprint area map of the LAS file when using the footprint parameter (the footprint is generated by PDAL).
Since a new raster map is created during the binning, the binning of points depends on the computational region settings (extent and resolution) which is by default set to the extent of the LiDAR input file (see more about binning below). The resulting raster resolution can be specified with the parameter resolution.
r.in.pdal is designed for processing massive point cloud datasets, for example raw LiDAR or sidescan sonar swath data. It has been tested with large datasets.
For details concerning raster binning see the manual page of r.in.lidar.
NOTES
r.in.pdal uses g.region to set the extent and resolution of the resulting raster and internally r.in.xyz to import the LiDAR points.
EXAMPLES
Import LAS file using PDAL
Import of a LAS file using PDAL into a mapset in the sample NC SPM location.
Dowload the sample LAS file by clicking on the link below.
Download: lidar_raleigh_nc_spm_height_feet.las.
# check metadata
pdal info --summary lidar_raleigh_nc_spm_height_feet.las

# scan extent and exit
r.in.pdal input=lidar_raleigh_nc_spm_height_feet.las output=lidar_raleigh -s

# scan extent (g.region style) and exit
r.in.pdal input=lidar_raleigh_nc_spm_height_feet.las output=lidar_raleigh -s -g
# n=228500 s=215000.01 w=633370.82 e=645000 t=558.87 b=88.5

# set computation region to this extent
g.region n=228500 s=215000.01 w=633370.82 e=645000 -p

# import while aligning pixel geometry to existing "elevation" 10m res. raster map
# specifying EPSG manually because SRS information is missing in this LAS file
r.in.pdal input=lidar_raleigh_nc_spm_height_feet.las raster_reference=elevation \
          resolution=10 output=lidar_raleigh method=mean

# optionally: footprint=lidar_raleigh_footprint

# visualize
d.mon wx0
g.list vector
d.rast lidar_raleigh
d.vect streets_wake

# analyse differences between DEM and rasterized point cloud
# LAS files come with height in US feet units
r.mapcalc "diff = elevation - lidar_raleigh * 0.3048006096012192"
r.univar -e diff
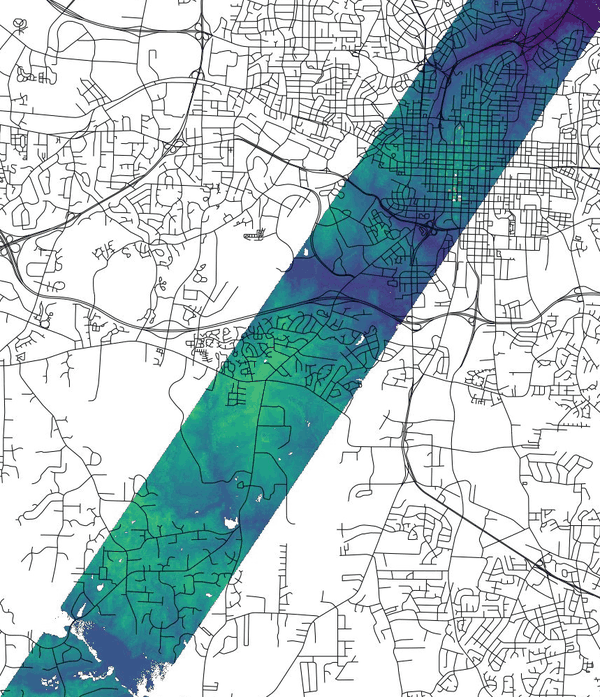
Figure: View showing the difference of the elevation map and LiDAR
point data binned to raster map with r.in.pdal

Figure: LiDAR cloud footprint
Import LAZ file using PDAL docker
Import of a LAZ file using PDAL docker into a mapset in the sample NC SPM location. The sample LAZ file is available for download with the link below.
Download: simple.laz.
# pulling official PDAL docker image
docker pull pdal/pdal

# using PDAL docker as command with mounted data volume
# (caution: the LAZ file has to be stored in the mounted folder! (here: $(pwd)))
export pdal_docker="docker run --rm -v $(pwd):/data -t pdal/pdal pdal"

# scan extent and exit
r.in.pdal input=/data/simple.laz output=lidar -s pdal_cmd="$pdal_docker"

# scan extent (g.region style) and exit
r.in.pdal input=/data/simple.laz output=lidar -s -g pdal_cmd="$pdal_docker"
# n=853535.43 s=848899.7 w=635619.85 e=638982.55 t=586.38 b=406.59

# set computation region to this extent
g.region n=853535.43 s=848899.7 w=635619.85 e=638982.55 -p

# import data
r.in.pdal input=/data/simple.laz output=lidar_perc95 method=percentile pth=95 pdal_cmd="$pdal_docker"

r.univar lidar_perc95
SEE ALSO
r.in.xyz, r.in.lidar, v.in.lidar
AUTHORS
Anika Bettge, mundialis GmbH & Co. KG
Vaclav Petras, NCSU GeoForAll
Lab (projection, computational
region)
Documentation: Markus Neteler, mundialis GmbH & Co. KG
SOURCE CODE
Available at: r.in.pdal source code
(history)
Latest change: Thursday May 29 11:23:19 2025 in commit 701c59b