r.to.vect.lines
Convert raster rows to vector lines.
r.to.vect.lines [-v] input=name output=name [skip=integer] [--overwrite] [--verbose] [--quiet] [--qq] [--ui]
Example:
r.to.vect.lines input=name output=name
grass.tools.Tools.r_to_vect_lines(input, output, skip=10, flags=None, overwrite=None, verbose=None, quiet=None, superquiet=None)
Example:
tools = Tools()
tools.r_to_vect_lines(input="name", output="name")
This grass.tools API is experimental in version 8.5 and expected to be stable in version 8.6.
grass.script.run_command("r.to.vect.lines", input, output, skip=10, flags=None, overwrite=None, verbose=None, quiet=None, superquiet=None)
Example:
gs.run_command("r.to.vect.lines", input="name", output="name")
Parameters
input=name [required]
Name of input raster map
output=name [required]
Name for output vector map
skip=integer
Sample every Nth grid row
Allowed values: 1-100000
Default: 10
-v
Sample vertically (default is to sample horizontally)
--overwrite
Allow output files to overwrite existing files
--help
Print usage summary
--verbose
Verbose module output
--quiet
Quiet module output
--qq
Very quiet module output
--ui
Force launching GUI dialog
input : str | np.ndarray, required
Name of input raster map
Used as: input, raster, name
output : str, required
Name for output vector map
Used as: output, vector, name
skip : int, optional
Sample every Nth grid row
Allowed values: 1-100000
Default: 10
flags : str, optional
Allowed values: v
v
Sample vertically (default is to sample horizontally)
overwrite : bool, optional
Allow output files to overwrite existing files
Default: None
verbose : bool, optional
Verbose module output
Default: None
quiet : bool, optional
Quiet module output
Default: None
superquiet : bool, optional
Very quiet module output
Default: None
Returns:
result : grass.tools.support.ToolResult | None
If the tool produces text as standard output, a ToolResult object will be returned. Otherwise, None will be returned.
Raises:
grass.tools.ToolError: When the tool ended with an error.
input : str, required
Name of input raster map
Used as: input, raster, name
output : str, required
Name for output vector map
Used as: output, vector, name
skip : int, optional
Sample every Nth grid row
Allowed values: 1-100000
Default: 10
flags : str, optional
Allowed values: v
v
Sample vertically (default is to sample horizontally)
overwrite : bool, optional
Allow output files to overwrite existing files
Default: None
verbose : bool, optional
Verbose module output
Default: None
quiet : bool, optional
Quiet module output
Default: None
superquiet : bool, optional
Very quiet module output
Default: None
NOTES
Extracts rows from a raster map as 3D vector lines.
Reads a raster map, writes to a vector map.
Doesn't check if output map already exists. (fixme)
The category given to the line refers to the row number. (starting with category 0!)
Nulls within a row are skipped, so holes will be filled by a straight line. (fixme) Nulls at the ends of lines are not included in the output line.
Nulls are not handled very well and may sneak through as very negative numbers. (fixme)
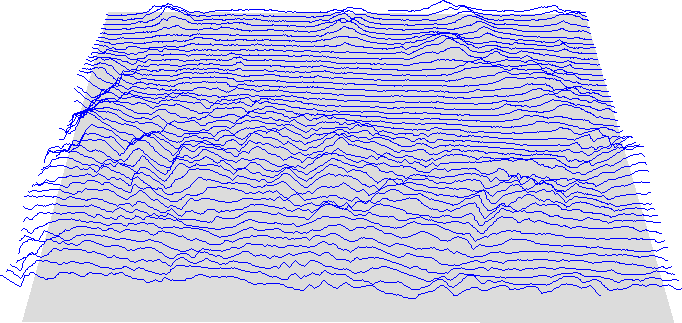
EXAMPLE
Display a wiggle plot in NVIZ:
(Spearfish dataset)
g.region raster=elevation.dem
r.to.vect.lines.py in=elevation.dem out=wiggle_lines
eval `v.info -g wiggle_lines`
r.mapcalc "floor = $bottom"
nviz elev=floor vector=wiggle_lines

# alternative
m.nviz.image elevation_map=floor vline=wiggle_lines resolution_fine=1 \
  zexag=20 out=wiggle.png perspective=5
SEE ALSO
AUTHOR
Hamish Bowman
Dept. of Geology
University of Otago
Dunedin, New Zealand
SOURCE CODE
Available at: r.to.vect.lines source code
(history)
Latest change: Wednesday Mar 11 08:17:30 2026 in commit 2a14bbb