r.vect.stats
Bins vector points into a raster map.
r.vect.stats input=name output=name [column=name] [method=string] [--overwrite] [--verbose] [--quiet] [--qq] [--ui]
Example:
r.vect.stats input=name output=name
grass.tools.Tools.r_vect_stats(input, output, column=None, method="mean", overwrite=None, verbose=None, quiet=None, superquiet=None)
Example:
tools = Tools()
tools.r_vect_stats(input="name", output="name")
This grass.tools API is experimental in version 8.5 and expected to be stable in version 8.6.
grass.script.run_command("r.vect.stats", input, output, column=None, method="mean", overwrite=None, verbose=None, quiet=None, superquiet=None)
Example:
gs.run_command("r.vect.stats", input="name", output="name")
Parameters
input=name [required]
Name of input vector map
Or data source for direct OGR access
output=name [required]
Name for output raster map
column=name
Name of attribute column for statistics
method=string
Statistic to use for raster values
Allowed values: n, min, max, range, sum, mean, stddev, variance, coeff_var, median, percentile, skewness, trimmean
Default: mean
n: Number of points in cell
min: Minimum value of point values in cell
max: Maximum value of point values in cell
range: Range of point values in cell
sum: Sum of point values in cell
mean: Mean (average) value of point values in cell
stddev: Standard deviation of point values in cell
variance: Variance of point values in cell
coeff_var: Coefficient of variance of point values in cell
median: Median value of point values in cell
percentile: Pth (nth) percentile of point values in cell
skewness: Skewness of point values in cell
trimmean: Trimmed mean of point values in cell
--overwrite
Allow output files to overwrite existing files
--help
Print usage summary
--verbose
Verbose module output
--quiet
Quiet module output
--qq
Very quiet module output
--ui
Force launching GUI dialog
input : str, required
Name of input vector map
Or data source for direct OGR access
Used as: input, vector, name
output : str | type(np.ndarray) | type(np.array) | type(gs.array.array), required
Name for output raster map
Used as: output, raster, name
column : str, optional
Name of attribute column for statistics
Used as: input, dbcolumn, name
method : str, optional
Statistic to use for raster values
Allowed values: n, min, max, range, sum, mean, stddev, variance, coeff_var, median, percentile, skewness, trimmean
n: Number of points in cell
min: Minimum value of point values in cell
max: Maximum value of point values in cell
range: Range of point values in cell
sum: Sum of point values in cell
mean: Mean (average) value of point values in cell
stddev: Standard deviation of point values in cell
variance: Variance of point values in cell
coeff_var: Coefficient of variance of point values in cell
median: Median value of point values in cell
percentile: Pth (nth) percentile of point values in cell
skewness: Skewness of point values in cell
trimmean: Trimmed mean of point values in cell
Default: mean
overwrite : bool, optional
Allow output files to overwrite existing files
Default: None
verbose : bool, optional
Verbose module output
Default: None
quiet : bool, optional
Quiet module output
Default: None
superquiet : bool, optional
Very quiet module output
Default: None
Returns:
result : grass.tools.support.ToolResult | np.ndarray | tuple[np.ndarray] | None
If the tool produces text as standard output, a ToolResult object will be returned. Otherwise, None will be returned. If an array type (e.g., np.ndarray) is used for one of the raster outputs, the result will be an array and will have the shape corresponding to the computational region. If an array type is used for more than one raster output, the result will be a tuple of arrays.
Raises:
grass.tools.ToolError: When the tool ended with an error.
input : str, required
Name of input vector map
Or data source for direct OGR access
Used as: input, vector, name
output : str, required
Name for output raster map
Used as: output, raster, name
column : str, optional
Name of attribute column for statistics
Used as: input, dbcolumn, name
method : str, optional
Statistic to use for raster values
Allowed values: n, min, max, range, sum, mean, stddev, variance, coeff_var, median, percentile, skewness, trimmean
n: Number of points in cell
min: Minimum value of point values in cell
max: Maximum value of point values in cell
range: Range of point values in cell
sum: Sum of point values in cell
mean: Mean (average) value of point values in cell
stddev: Standard deviation of point values in cell
variance: Variance of point values in cell
coeff_var: Coefficient of variance of point values in cell
median: Median value of point values in cell
percentile: Pth (nth) percentile of point values in cell
skewness: Skewness of point values in cell
trimmean: Trimmed mean of point values in cell
Default: mean
overwrite : bool, optional
Allow output files to overwrite existing files
Default: None
verbose : bool, optional
Verbose module output
Default: None
quiet : bool, optional
Quiet module output
Default: None
superquiet : bool, optional
Very quiet module output
Default: None
DESCRIPTION
r.vect.stats bins points from a vector map into a raster map.
Use g.region to set the extent and resolution of the resulting raster.
EXAMPLES
Calculate number of schools in grid of spatial resolution 1km:
g.region res=1000 vector=schools_wake
r.vect.stats input=schools_wake output=schools_count
Calculate sum of atribute column CAPACITYTO:
r.vect.stats input=schools_wake output=schools_capacity_sum column=CAPACITYTO method=sum
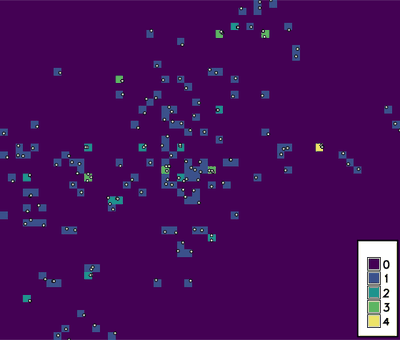
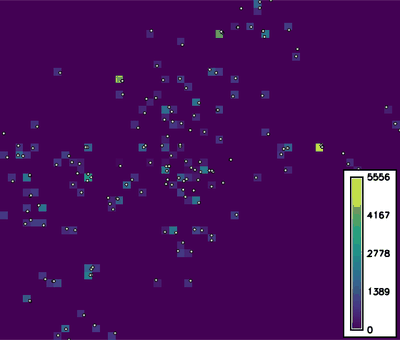
Figure: Number of schools (left part) and sum of CAPACITYTO attribute
column (right part) in grid of spatial resolution 1km.
SEE ALSO
g.region, v.out.ascii, r.in.xyz, r.in.lidar
AUTHORS
Vaclav Petras, NCSU GeoForAll
Lab
Column and method parameters added by Martin Landa, CTU GeoForAll
Lab
SOURCE CODE
Available at: r.vect.stats source code
(history)
Latest change: Wednesday Mar 11 08:17:30 2026 in commit 2a14bbb