d.region.grid
Drapes a color raster over an shaded relief or aspect map.
d.region.grid [-r] [region=name] [raster=name] [color=name] [width=float] [--verbose] [--quiet] [--qq] [--ui]
Example:
d.region.grid region=name
grass.tools.Tools.d_region_grid(region=None, raster=None, color="gray", width=None, flags=None, verbose=None, quiet=None, superquiet=None)
Example:
tools = Tools()
tools.d_region_grid(region="name")
This grass.tools API is experimental in version 8.5 and expected to be stable in version 8.6.
grass.script.run_command("d.region.grid", region=None, raster=None, color="gray", width=None, flags=None, verbose=None, quiet=None, superquiet=None)
Example:
gs.run_command("d.region.grid", region="name")
Parameters
region=name
Use an existing saved region
raster=name
Use a raster map
color=name
Color
Grid color
Default: gray
width=float
Grid line width
-r
Use the current computation region
This will not work in cases when region is handled in a special way such as GUI
--help
Print usage summary
--verbose
Verbose module output
--quiet
Quiet module output
--qq
Very quiet module output
--ui
Force launching GUI dialog
region : str, optional
Use an existing saved region
Used as: input, region, name
raster : str | np.ndarray, optional
Use a raster map
Used as: input, raster, name
color : str, optional
Color
Grid color
Used as: input, color, name
Default: gray
width : float, optional
Grid line width
flags : str, optional
Allowed values: r
r
Use the current computation region
This will not work in cases when region is handled in a special way such as GUI
verbose : bool, optional
Verbose module output
Default: None
quiet : bool, optional
Quiet module output
Default: None
superquiet : bool, optional
Very quiet module output
Default: None
Returns:
result : grass.tools.support.ToolResult | None
If the tool produces text as standard output, a ToolResult object will be returned. Otherwise, None will be returned.
Raises:
grass.tools.ToolError: When the tool ended with an error.
region : str, optional
Use an existing saved region
Used as: input, region, name
raster : str, optional
Use a raster map
Used as: input, raster, name
color : str, optional
Color
Grid color
Used as: input, color, name
Default: gray
width : float, optional
Grid line width
flags : str, optional
Allowed values: r
r
Use the current computation region
This will not work in cases when region is handled in a special way such as GUI
verbose : bool, optional
Verbose module output
Default: None
quiet : bool, optional
Quiet module output
Default: None
superquiet : bool, optional
Very quiet module output
Default: None
DESCRIPTION
d.region.grid plots a grid defined by the computational region or by a raster map. The computational region can be the current computational region or a saved computational region.
EXAMPLES
Comparing grids of two rasters
To compare how grids (resolutions) of two rasters align, here a digital elevation model and a Landsat image, you can zoom to an area of interest and show grids of both rasters. First, zoom close enough that the raster cells become visible. Here a small saved region is used and a negative value for grow causes g.region to zoom-in even more:
g.region region=rural_1m grow=-250 -p
Start a monitor (skip this in the GUI):
d.mon start=cairo width=600 height=400 output=two_rasters.png
Optionally, show the digital elevation model and its shaded relief raster:
d.shade shade=elevation_shade color=elevation
Add grid for the elevation raster using a subtle color:
d.region.grid raster=elevation color="#9B520D"
Add grid for the Landsat raster using a high-contrast color:
d.region.grid raster=lsat7_2002_10 color=black
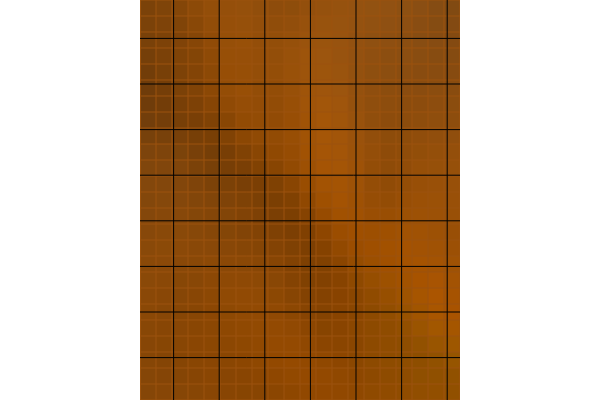
Figure: Grids of two rasters which are not aligned
If you are using d.mon, you can stop the monitor using:
d.mon stop=cairo
Showing the current computational region grid
Let's say you want to render grid cells of a computational region you plan to resample a raster map into. First, set the computational region to the raster map, then start the monitor (here we use file-based rendering in the command line with the cairo driver), and finally, render the raster map:
g.region raster=elevation
d.mon start=cairo width=600 height=400 output=new_region_grid.png
d.rast map=elevation
Then change to the desired computational region, here the new region resolution is set to 1000 meters (map units) and fitted into the current region extent without modifying the 1000 meters value.
g.region res=1000 -a
Now, you are ready to plot the grid of the current computational region:
d.region.grid -r
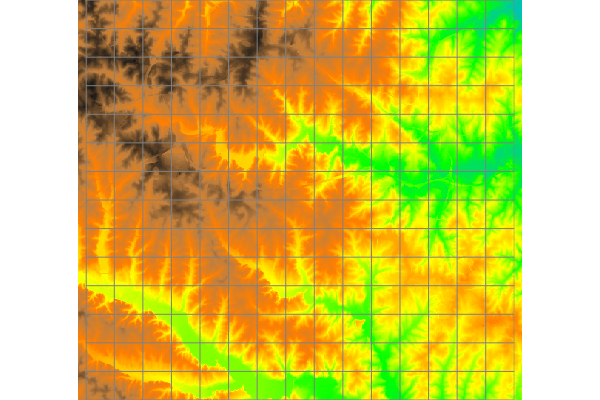
Figure: Raster with resolution 10 meters and grid of a computational region with resolution 1000 meters
Assuming you used d.mon to start rendering as in the code above, you can stop it using:
d.mon stop=cairo
Using an existing saved region
Displaying a saved computational region is extremely helpful in GUI, were you save the current region first:
g.region save=study_area
Then, you use Add command layer to add the following command:
d.region.grid region=study_area
NOTES
- Use through the Add command layer option in the GUI.
- In the GUI, it is currently not possible to directly draw the current region.
- Generally, only the grid resolution is based on the selected region or raster, with extent of the grid being limited only by what is being displayed (this happens to be the current computational region when rendering directly to files in command line).
SEE ALSO
g.region, d.grid, d.rast.num, d.mon, v.mkgrid
AUTHOR
Vaclav Petras, NCSU GeoForAll Lab
SOURCE CODE
Available at: d.region.grid source code
(history)
Latest change: Sunday Feb 15 05:33:58 2026 in commit 14d04cb