r.boxplot
Draws the boxplot of raster values. Optionally, this is done per category of a zonal raster layer
r.boxplot [-onhsc] map=name [zones=name] [output=name] [plot_dimensions=string] [fontsize=integer] [dpi=integer] [map_outliers=string] [range=float] [raster_statistics=string [,string,...]] [order=string] [rotate_labels=float] [raster_stat_color=name] [raster_stat_alpha=float] [bx_color=name] [area_label=string] [bx_width=float] [bx_width_variable=string] [bx_lw=float] [median_lw=float] [median_color=name] [whisker_linewidth=float] [flier_marker=string] [flier_size=string] [flier_color=name] [--overwrite] [--verbose] [--quiet] [--qq] [--ui]
Example:
r.boxplot map=name
grass.tools.Tools.r_boxplot(map, zones=None, output=None, plot_dimensions=None, fontsize=10, dpi=None, map_outliers=None, range=1.5, raster_statistics=None, order=None, rotate_labels=None, raster_stat_color="grey", raster_stat_alpha=0.2, bx_color="white", area_label=None, bx_width=0.75, bx_width_variable=None, bx_lw=1, median_lw=1.1, median_color="orange", whisker_linewidth=1, flier_marker="o", flier_size="2", flier_color="black", flags=None, overwrite=None, verbose=None, quiet=None, superquiet=None)
Example:
tools = Tools()
tools.r_boxplot(map="name")
This grass.tools API is experimental in version 8.5 and expected to be stable in version 8.6.
grass.script.run_command("r.boxplot", map, zones=None, output=None, plot_dimensions=None, fontsize=10, dpi=None, map_outliers=None, range=1.5, raster_statistics=None, order=None, rotate_labels=None, raster_stat_color="grey", raster_stat_alpha=0.2, bx_color="white", area_label=None, bx_width=0.75, bx_width_variable=None, bx_lw=1, median_lw=1.1, median_color="orange", whisker_linewidth=1, flier_marker="o", flier_size="2", flier_color="black", flags=None, overwrite=None, verbose=None, quiet=None, superquiet=None)
Example:
gs.run_command("r.boxplot", map="name")
Parameters
map=name [required]
Name of raster map
zones=name
Zonal raster
categorical map with zones
output=name
Name of output image file
Name for output file
plot_dimensions=string
Plot dimensions (width,height)
Dimensions (width,height) of the figure in inches
fontsize=integer
Font size
Default font size
Default: 10
dpi=integer
DPI
resolution of plot
map_outliers=string
Name of outlier map
Create a vector point layer of outliers
range=float
Range (value > 0)
this determines how far the plot whiskers extend out from the box. If range is positive, the whiskers extend to the most extreme data point which is no more than range times the interquartile range from the box. A value of zero causes the whiskers to extend to the data extremes.
Default: 1.5
raster_statistics=string [,string,...]
Plot the raster median and IQR
Allowed values: median, IQR
order=string
Sort boxplots
Sort boxplots based on their median values
Allowed values: descending, ascending
rotate_labels=float
Rotate labels
Rotate labels (degrees)
Allowed values: -90-90
raster_stat_color=name
Color of the raster IQR and median
Color of raster IQR and median
Default: grey
raster_stat_alpha=float
Transparency of the raster IQR band
Allowed values: 0-1
Default: 0.2
bx_color=name
Color of the boxplots
Color of boxplots
Default: white
area_label=string
Show the area above each boxplot
Allowed values: m2, ha, km2, acres, mi2
bx_width=float
Boxplot width
The width of the boxplots (0,1])
Allowed values: 0-1
Default: 0.75
bx_width_variable=string
Set the width of the boxplots proportional to the area of the zones (linear) or the square root of the zones (sqrt).
Allowed values: linear, sqrt
bx_lw=float
boxplot linewidth
The linewidth of the boxplots
Default: 1
median_lw=float
width of the boxplot median line
Default: 1.1
median_color=name
Color of the boxlot median line
Color of median
Default: orange
whisker_linewidth=float
Whisker and cap linewidth
The linewidth of the whiskers and caps
Default: 1
flier_marker=string
Flier marker
Set flier marker (see https://matplotlib.org/stable/api/markers_api.html for options)
Default: o
flier_size=string
Flier size
Set the flier size
Default: 2
flier_color=name
Flier color
Set the flier color
Default: black
-o
Include outliers
Draw boxplot(s) with outliers
-n
Draw notches
Draw boxplot(s) with notch
-h
Horizontal boxplot(s)
Draw the boxplot horizontal
-s
Show category numbers
Show the category numbers of the zonal map
-c
Zonal colors
Color boxploxs using the colors of the categories of the zonal raster
--overwrite
Allow output files to overwrite existing files
--help
Print usage summary
--verbose
Verbose module output
--quiet
Quiet module output
--qq
Very quiet module output
--ui
Force launching GUI dialog
map : str | np.ndarray, required
Name of raster map
Used as: input, raster, name
zones : str | np.ndarray, optional
Zonal raster
categorical map with zones
Used as: input, raster, name
output : str, optional
Name of output image file
Name for output file
Used as: output, file, name
plot_dimensions : str, optional
Plot dimensions (width,height)
Dimensions (width,height) of the figure in inches
fontsize : int, optional
Font size
Default font size
Default: 10
dpi : int, optional
DPI
resolution of plot
map_outliers : str, optional
Name of outlier map
Create a vector point layer of outliers
range : float, optional
Range (value > 0)
this determines how far the plot whiskers extend out from the box. If range is positive, the whiskers extend to the most extreme data point which is no more than range times the interquartile range from the box. A value of zero causes the whiskers to extend to the data extremes.
Default: 1.5
raster_statistics : str | list[str], optional
Plot the raster median and IQR
Allowed values: median, IQR
order : str, optional
Sort boxplots
Sort boxplots based on their median values
Allowed values: descending, ascending
rotate_labels : float, optional
Rotate labels
Rotate labels (degrees)
Allowed values: -90-90
raster_stat_color : str, optional
Color of the raster IQR and median
Color of raster IQR and median
Used as: input, color, name
Default: grey
raster_stat_alpha : float, optional
Transparency of the raster IQR band
Allowed values: 0-1
Default: 0.2
bx_color : str, optional
Color of the boxplots
Color of boxplots
Used as: input, color, name
Default: white
area_label : str, optional
Show the area above each boxplot
Allowed values: m2, ha, km2, acres, mi2
bx_width : float, optional
Boxplot width
The width of the boxplots (0,1])
Allowed values: 0-1
Default: 0.75
bx_width_variable : str, optional
Set the width of the boxplots proportional to the area of the zones (linear) or the square root of the zones (sqrt).
Allowed values: linear, sqrt
bx_lw : float, optional
boxplot linewidth
The linewidth of the boxplots
Default: 1
median_lw : float, optional
width of the boxplot median line
Default: 1.1
median_color : str, optional
Color of the boxlot median line
Color of median
Used as: input, color, name
Default: orange
whisker_linewidth : float, optional
Whisker and cap linewidth
The linewidth of the whiskers and caps
Default: 1
flier_marker : str, optional
Flier marker
Set flier marker (see https://matplotlib.org/stable/api/markers_api.html for options)
Default: o
flier_size : str, optional
Flier size
Set the flier size
Default: 2
flier_color : str, optional
Flier color
Set the flier color
Used as: input, color, name
Default: black
flags : str, optional
Allowed values: o, n, h, s, c
o
Include outliers
Draw boxplot(s) with outliers
n
Draw notches
Draw boxplot(s) with notch
h
Horizontal boxplot(s)
Draw the boxplot horizontal
s
Show category numbers
Show the category numbers of the zonal map
c
Zonal colors
Color boxploxs using the colors of the categories of the zonal raster
overwrite : bool, optional
Allow output files to overwrite existing files
Default: None
verbose : bool, optional
Verbose module output
Default: None
quiet : bool, optional
Quiet module output
Default: None
superquiet : bool, optional
Very quiet module output
Default: None
Returns:
result : grass.tools.support.ToolResult | None
If the tool produces text as standard output, a ToolResult object will be returned. Otherwise, None will be returned.
Raises:
grass.tools.ToolError: When the tool ended with an error.
map : str, required
Name of raster map
Used as: input, raster, name
zones : str, optional
Zonal raster
categorical map with zones
Used as: input, raster, name
output : str, optional
Name of output image file
Name for output file
Used as: output, file, name
plot_dimensions : str, optional
Plot dimensions (width,height)
Dimensions (width,height) of the figure in inches
fontsize : int, optional
Font size
Default font size
Default: 10
dpi : int, optional
DPI
resolution of plot
map_outliers : str, optional
Name of outlier map
Create a vector point layer of outliers
range : float, optional
Range (value > 0)
this determines how far the plot whiskers extend out from the box. If range is positive, the whiskers extend to the most extreme data point which is no more than range times the interquartile range from the box. A value of zero causes the whiskers to extend to the data extremes.
Default: 1.5
raster_statistics : str | list[str], optional
Plot the raster median and IQR
Allowed values: median, IQR
order : str, optional
Sort boxplots
Sort boxplots based on their median values
Allowed values: descending, ascending
rotate_labels : float, optional
Rotate labels
Rotate labels (degrees)
Allowed values: -90-90
raster_stat_color : str, optional
Color of the raster IQR and median
Color of raster IQR and median
Used as: input, color, name
Default: grey
raster_stat_alpha : float, optional
Transparency of the raster IQR band
Allowed values: 0-1
Default: 0.2
bx_color : str, optional
Color of the boxplots
Color of boxplots
Used as: input, color, name
Default: white
area_label : str, optional
Show the area above each boxplot
Allowed values: m2, ha, km2, acres, mi2
bx_width : float, optional
Boxplot width
The width of the boxplots (0,1])
Allowed values: 0-1
Default: 0.75
bx_width_variable : str, optional
Set the width of the boxplots proportional to the area of the zones (linear) or the square root of the zones (sqrt).
Allowed values: linear, sqrt
bx_lw : float, optional
boxplot linewidth
The linewidth of the boxplots
Default: 1
median_lw : float, optional
width of the boxplot median line
Default: 1.1
median_color : str, optional
Color of the boxlot median line
Color of median
Used as: input, color, name
Default: orange
whisker_linewidth : float, optional
Whisker and cap linewidth
The linewidth of the whiskers and caps
Default: 1
flier_marker : str, optional
Flier marker
Set flier marker (see https://matplotlib.org/stable/api/markers_api.html for options)
Default: o
flier_size : str, optional
Flier size
Set the flier size
Default: 2
flier_color : str, optional
Flier color
Set the flier color
Used as: input, color, name
Default: black
flags : str, optional
Allowed values: o, n, h, s, c
o
Include outliers
Draw boxplot(s) with outliers
n
Draw notches
Draw boxplot(s) with notch
h
Horizontal boxplot(s)
Draw the boxplot horizontal
s
Show category numbers
Show the category numbers of the zonal map
c
Zonal colors
Color boxploxs using the colors of the categories of the zonal raster
overwrite : bool, optional
Allow output files to overwrite existing files
Default: None
verbose : bool, optional
Verbose module output
Default: None
quiet : bool, optional
Quiet module output
Default: None
superquiet : bool, optional
Very quiet module output
Default: None
DESCRIPTION
r.boxplot draws boxplots of the raster values of an input raster map. The user has the option to define a zonal (categorical) map. In that case, a boxplot will be drawn for each zone, using the values of the input raster that fall within that zone.
If there is a zonal map, the user can add a line and band to represent the median and interquartile range (IQR) of the input layer. Note that all values of the input raster (within the region's extent) are used to compute the median and IQR. If the zones of the zonal map cover only part of the region, the user can mask out the non-covered parts of the input map first by means of r.mask. That will result in an IQR and median representing the values that fall within the zones of the zonal map only. Otherwise, the computational region can be changed to fit the extent of the zonal map with g.region.
To visually account for differences in the total area covered by each zone, you can optionally scale the width of each boxplot proportionally to the area of its corresponding category using the bx_width_variable option. This can be done linearly or using the square root of the area, depending on the selected mode (linear or sqrt). In addition, the user can opt to print the area of each zone above the boxplot.
By default, the resulting plot is displayed on screen. However, the user can also save the plot to file using the output option. The format is determined by the extension given by the user. So, if output = outputfile.png, the plot will be saved as a PNG file.
The whiskers extend to the most extreme data point, which is no more than
range ✕ the IQR from the box. By default, a range of 1.5 is used, but
the user can change this. Note that range values need to be larger than 0.
By default, outliers are not included in the plot. Set the -o flag to include them in the plot. To also create a point vector map with the locations of the outliers, the user needs to provide the name of the output map using map_outliers.
There are a few layout options, including the option to rotate the plot and the x-axis labels, print the boxplot(s) with notches, sort the boxplot from low to high (ascending) or from high to low (descending) median, color the boxplots according to the corresponding categories of the zonal raster, set the type and color of the outliers, set the color and width of the median line(s), set the color and transparency of the raster's median line and IQR band, and set the width of the boxplots.
NOTE
The r.boxplot module operates on the raster array defined by the current region settings, not the original extent and resolution of the input map. See g.region to understand the impact of the region settings on the calculations. To include outliers, the function converts the raster cell with outlier values to a point vector layer. This may take some time if there are a lot of outliers. So, if users are working with very large raster layers, they should be cautious to not set the range value too low as that may result in a huge number of outliers.
The zonal map needs to be an integer map. If it is not, the function will exit with the error message, 'The zonal raster must be of type CELL (integer)'.
If the -c flag is used, the bxp_color and median_color are ignored, even if set by the user. The option to color boxploxs using the colors of the zonal raster categories (c flag) only works if the zonal map contains a color table. If it does not, the function exits with the error message that 'The zonal map does not have a color table'. If the user thinks there is a color table, run r.colors.out and check if the categories are integers. If not, that is the problem. If they are all integers, you probably have caught a bug.
The module respects the mask (if set), and the region settings. This means you can quickly change the area for which to create a boxplot by simply changing the region and/or setting a (different) mask.
EXAMPLE
Example 1
Draw a boxplot of the values of the elevation layer from the NC sample
dataset. Set the -h flag to print
the boxplot horizontally. Set the plot dimensions to 7 inch wide, 1 inch high.
g.region raster=elevation
r.boxplot -h input=elevation plot_dimensions="7,1" output="r_boxplot_01.png"

Example 2
Draw boxplots of the values of the elevation layer per category from
the landclass96 layer from the same NC sample
dataset. Use the -r flag to
rotate the x-asis labels.
r.boxplot -r input=elevation zone=landclass96 output="r_boxplot_02.png"

Example 3
Draw boxplots of the values of the elevation layer per category from the
landclass96 layer from the same NC sample
dataset. Set the -o flag to
include outliers. Use bx_sort=ascending to order the boxplots from low to
high median. Provide a name for the outlier map to save the outlier locations
as a point vector map.
r.boxplot -o bx_sort=ascending input=elevation zones=landclass96 output="r_boxplot_03.png" map_outliers="outliers"

Below, part of the landclass96 raster map is shown, with the vector
point layer with location of outliers on top. Curiously, for some lakes,
only part of the raster cells are outliers.

Example 4
Draw boxplots of the values of the elevation layer per category from the
landclass96 layer from the same NC sample
dataset. Set the -c flag to color
the boxplots, use bx_sort=ascending to order the boxplots from low to high
median, and set the font size to 11.
r.boxplot -c bx_sort=ascending fontsize=11 input=elevation zones=landclass96 output="r_boxplot_04.png"
Example 5
To make it easier to compare the elevation distribution across the different land classes, you can plot a line and band representing the median and interquartile range of the whole raster layer.
r.boxplot -c input=elevation zones=landclass96 raster_statistics=median,IQR
Note, if the zones of your zonal map do not cover the entire area, you may want to use r.mask to mask out the non-covered parts of the input map, or alternatively, create a new input raster with only values within the zones of the zonal layer.

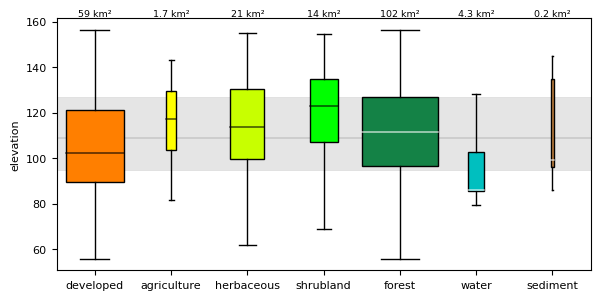
Example 6
To visualize the differences in surface area per land use category, you can set the width of the boxplots proportionally to the surface area or the square root of the surface area. The width of the largest zone is always set to the user-defined maximum (specified by bxp_width), and all other box widths are scaled relative to that.
r.boxplot -c input=elevation zones=landclass96 raster_statistics=median,IQR bx_width=1 bx_width_variable="sqrt" area_label="km2"
The code above also print the surface area of each zone above the corresponding boxplot in square kilometers.
Acknowledgements
This work was carried in the framework of the Save the tiger, save the grassland, save the water project by the Innovative Bio-Monitoring research group.
SEE ALSO
r.scatterplot, r.stats.zonal, v.boxplot
AUTHOR
Paulo van Breugel, HAS green academy, Innovative Biomonitoring research group, Climate-robust Landscapes research group
SOURCE CODE
Available at: r.boxplot source code
(history)
Latest change: Tuesday Jun 16 19:07:10 2026 in commit d30861c