r.colors.cubehelix
Create or apply a cubehelix color table to a GRASS raster map
r.colors.cubehelix [-dngae] [map=name [,name,...]] [output=name] [start=float] [nrotations=float] [gamma=float] [hue=float] [light=float] [dark=float] [ncolors=integer] [--overwrite] [--verbose] [--quiet] [--qq] [--ui]
Example:
r.colors.cubehelix
grass.tools.Tools.r_colors_cubehelix(map=None, output=None, start=0, nrotations=0.4, gamma=1.0, hue=0.8, light=0.85, dark=0.15, ncolors=6, flags=None, overwrite=None, verbose=None, quiet=None, superquiet=None)
Example:
tools = Tools()
tools.r_colors_cubehelix()
This grass.tools API is experimental in version 8.5 and expected to be stable in version 8.6.
grass.script.run_command("r.colors.cubehelix", map=None, output=None, start=0, nrotations=0.4, gamma=1.0, hue=0.8, light=0.85, dark=0.15, ncolors=6, flags=None, overwrite=None, verbose=None, quiet=None, superquiet=None)
Example:
gs.run_command("r.colors.cubehelix")
Parameters
map=name [,name,...]
Raster map(s) to apply color table to
output=name
Name for the new color table rules file
start=float
The hue at the start of the helix
Allowed values: 0-3
Default: 0
nrotations=float
Rotations around the hue wheel
Rotations around the hue wheel over the range of the color table
Allowed values: 0-3
Default: 0.4
gamma=float
Gamma factor to emphasize darker (<1) or lighter (>1) colors
Allowed values: 0-
Default: 1.0
hue=float
Saturation of the colors
Allowed values: 0-1
Default: 0.8
light=float
Intensity of the lightest color in the color table
Allowed values: 0-1
Default: 0.85
dark=float
Intensity of the darkest color in the color table
Allowed values: 0-1
Default: 0.15
ncolors=integer
Number of colors in the color table
Number of color intervals in a discrete color table with -d
Allowed values: 2-
Default: 6
-d
Generate discrete color table
Generate discrete (interval) color table instead of a continuous one
-n
Reverse the order of colors (invert colors)
If set, the color table will go from dark to light
-g
Logarithmic scaling
-a
Logarithmic-absolute scaling
-e
Histogram equalization
--overwrite
Allow output files to overwrite existing files
--help
Print usage summary
--verbose
Verbose module output
--quiet
Quiet module output
--qq
Very quiet module output
--ui
Force launching GUI dialog
map : str | list[str], optional
Raster map(s) to apply color table to
Used as: input, raster, name
output : str, optional
Name for the new color table rules file
Used as: output, file, name
start : float, optional
The hue at the start of the helix
Allowed values: 0-3
Default: 0
nrotations : float, optional
Rotations around the hue wheel
Rotations around the hue wheel over the range of the color table
Allowed values: 0-3
Default: 0.4
gamma : float, optional
Gamma factor to emphasize darker (<1) or lighter (>1) colors
Allowed values: 0-
Default: 1.0
hue : float, optional
Saturation of the colors
Allowed values: 0-1
Default: 0.8
light : float, optional
Intensity of the lightest color in the color table
Allowed values: 0-1
Default: 0.85
dark : float, optional
Intensity of the darkest color in the color table
Allowed values: 0-1
Default: 0.15
ncolors : int, optional
Number of colors in the color table
Number of color intervals in a discrete color table with -d
Allowed values: 2-
Default: 6
flags : str, optional
Allowed values: d, n, g, a, e
d
Generate discrete color table
Generate discrete (interval) color table instead of a continuous one
n
Reverse the order of colors (invert colors)
If set, the color table will go from dark to light
g
Logarithmic scaling
a
Logarithmic-absolute scaling
e
Histogram equalization
overwrite : bool, optional
Allow output files to overwrite existing files
Default: None
verbose : bool, optional
Verbose module output
Default: None
quiet : bool, optional
Quiet module output
Default: None
superquiet : bool, optional
Very quiet module output
Default: None
Returns:
result : grass.tools.support.ToolResult | None
If the tool produces text as standard output, a ToolResult object will be returned. Otherwise, None will be returned.
Raises:
grass.tools.ToolError: When the tool ended with an error.
map : str | list[str], optional
Raster map(s) to apply color table to
Used as: input, raster, name
output : str, optional
Name for the new color table rules file
Used as: output, file, name
start : float, optional
The hue at the start of the helix
Allowed values: 0-3
Default: 0
nrotations : float, optional
Rotations around the hue wheel
Rotations around the hue wheel over the range of the color table
Allowed values: 0-3
Default: 0.4
gamma : float, optional
Gamma factor to emphasize darker (<1) or lighter (>1) colors
Allowed values: 0-
Default: 1.0
hue : float, optional
Saturation of the colors
Allowed values: 0-1
Default: 0.8
light : float, optional
Intensity of the lightest color in the color table
Allowed values: 0-1
Default: 0.85
dark : float, optional
Intensity of the darkest color in the color table
Allowed values: 0-1
Default: 0.15
ncolors : int, optional
Number of colors in the color table
Number of color intervals in a discrete color table with -d
Allowed values: 2-
Default: 6
flags : str, optional
Allowed values: d, n, g, a, e
d
Generate discrete color table
Generate discrete (interval) color table instead of a continuous one
n
Reverse the order of colors (invert colors)
If set, the color table will go from dark to light
g
Logarithmic scaling
a
Logarithmic-absolute scaling
e
Histogram equalization
overwrite : bool, optional
Allow output files to overwrite existing files
Default: None
verbose : bool, optional
Verbose module output
Default: None
quiet : bool, optional
Quiet module output
Default: None
superquiet : bool, optional
Very quiet module output
Default: None
DESCRIPTION
The r.colors.cubehelix module generates a cubehelix color table and assigns it to a given raster map if requested. The color table is generated using seaborn Python package. Several parameters are available to control the cubehelix. When option map is specified r.colors.cubehelix assigns the color rules to the given raster map. The color tables are always stretched based on the range of values of the map
Depending on the use case, it may be advantageous to use the -d to discretize the color table into intervals.
NOTES
This module depends on seaborn which needs to be installed on your computer. Use your Python package manager (e.g. pip) or distribution package manager to install it.
EXAMPLES
Creating a color table as GRASS color rules
We do 0.6 rotation around the axis and use discrete (interval) color table rather than the standard continuous. If we don't specify output file, it is printed to standard output:
r.colors.cubehelix -d ncolors=5 nrotations=0.6
0.000% 218:222:192
20.000% 218:222:192
20.000% 198:166:136
40.000% 198:166:136
40.000% 173:108:112
60.000% 173:108:112
60.000% 119:61:98
80.000% 119:61:98
80.000% 48:28:59
100.000% 48:28:59
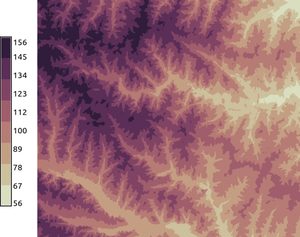
Setting color table for a raster map
Now we set several different color tables for the elevation raster map from the North Carolina sample dataset. We use continuous and discrete color tables (gradients). The color tables are stretched to fit the raster map range.
r.colors.cubehelix -d ncolors=8 nrotations=0.6 map=elevation
We can display legend:
d.legend raster=elevation labelnum=10 at=5,50,7,10
Here we set continuous color table with more colors
r.colors.cubehelix nrotations=1.4 start=4 map=elevation

Setting color table for a vector map
First we create a text file with color rules:
r.colors.cubehelix -i rot=0.6 output=cubehelix.txt
Then we set color table for the vector to the rules stored in a file:
v.colors map=points rules=cubehelix.txt
Color table for 3D raster map can be set in the same way.
REFERENCES
- Green, D. A., 2011, A colour scheme for the display of astronomical intensity images, Bulletin of the Astronomical Society of India, 39, 289.
SEE ALSO
r.colors, v.colors, r3.colors, r.cpt2grass, r.colors.matplotlib
seaborn cubehelix_palette function documentation and an example
AUTHOR
Vaclav Petras, NCSU GeoForAll Lab
SOURCE CODE
Available at: r.colors.cubehelix source code
(history)
Latest change: Wednesday Mar 11 08:17:30 2026 in commit 2a14bbb