r.out.legend
Create an image file showing the legend of a raster map
r.out.legend [-fdt] raster=name file=name filetype=extension dimensions=width,height [unit=unit] [resolution=value] [color=name] [labelnum=integer] [range=min,max] [label_values=float [,float,...]] [label_step=float] [digits=integer] [font=string] [fontsize=integer] [--overwrite] [--verbose] [--quiet] [--qq] [--ui]
Example:
r.out.legend raster=name file=name filetype=cairo dimensions=width,height
grass.tools.Tools.r_out_legend(raster, file, filetype="cairo", dimensions, unit="cm", resolution=None, color="white", labelnum=5, range=None, label_values=None, label_step=None, digits=1, font="Arial", fontsize=10, flags=None, overwrite=None, verbose=None, quiet=None, superquiet=None)
Example:
tools = Tools()
tools.r_out_legend(raster="name", file="name", filetype="cairo", dimensions="width,height")
This grass.tools API is experimental in version 8.5 and expected to be stable in version 8.6.
grass.script.run_command("r.out.legend", raster, file, filetype="cairo", dimensions, unit="cm", resolution=None, color="white", labelnum=5, range=None, label_values=None, label_step=None, digits=1, font="Arial", fontsize=10, flags=None, overwrite=None, verbose=None, quiet=None, superquiet=None)
Example:
gs.run_command("r.out.legend", raster="name", file="name", filetype="cairo", dimensions="width,height")
Parameters
raster=name [required]
Name of raster map
file=name [required]
Name of the output file (including file extension)
filetype=extension [required]
File type
Allowed values: png, ps, cairo
Default: cairo
dimensions=width,height [required]
width and height of the color legend
unit=unit
unit of the image dimensions
Allowed values: cm, mm, inch, px
Default: cm
resolution=value
resolution (dots/inch)
color=name
Color
Either a standard color name, R:G:B triplet, or "none"
Default: white
labelnum=integer
Number of text labels
Default: 5
range=min,max
Use a subset of the map range for the legend
label_values=float [,float,...]
Specific values to draw ticks
label_step=float
Display label every step
digits=integer
Maximum number of digits for raster value display
Default: 1
font=string
Font name
Default: Arial
fontsize=integer
Font size
Default: 10
-f
Flip legend
-d
Add histogram to legend
-t
Draw legend ticks for labels
--overwrite
Allow output files to overwrite existing files
--help
Print usage summary
--verbose
Verbose module output
--quiet
Quiet module output
--qq
Very quiet module output
--ui
Force launching GUI dialog
raster : str | np.ndarray, required
Name of raster map
Used as: input, raster, name
file : str, required
Name of the output file (including file extension)
Used as: output, file, name
filetype : str, required
File type
Used as: extension
Allowed values: png, ps, cairo
Default: cairo
dimensions : tuple[str, str] | list[str] | str, required
width and height of the color legend
Used as: width,height
unit : str, optional
unit of the image dimensions
Used as: unit
Allowed values: cm, mm, inch, px
Default: cm
resolution : int, optional
resolution (dots/inch)
Used as: value
color : str, optional
Color
Either a standard color name, R:G:B triplet, or "none"
Used as: input, color, name
Default: white
labelnum : int, optional
Number of text labels
Used as: integer
Default: 5
range : tuple[str, str] | list[str] | str, optional
Use a subset of the map range for the legend
Used as: min,max
label_values : str | list[str], optional
Specific values to draw ticks
Used as: float
label_step : str, optional
Display label every step
Used as: float
digits : int, optional
Maximum number of digits for raster value display
Used as: integer
Default: 1
font : str, optional
Font name
Used as: string
Default: Arial
fontsize : int, optional
Font size
Used as: integer
Default: 10
flags : str, optional
Allowed values: f, d, t
f
Flip legend
d
Add histogram to legend
t
Draw legend ticks for labels
overwrite : bool, optional
Allow output files to overwrite existing files
Default: None
verbose : bool, optional
Verbose module output
Default: None
quiet : bool, optional
Quiet module output
Default: None
superquiet : bool, optional
Very quiet module output
Default: None
Returns:
result : grass.tools.support.ToolResult | None
If the tool produces text as standard output, a ToolResult object will be returned. Otherwise, None will be returned.
Raises:
grass.tools.ToolError: When the tool ended with an error.
raster : str, required
Name of raster map
Used as: input, raster, name
file : str, required
Name of the output file (including file extension)
Used as: output, file, name
filetype : str, required
File type
Used as: extension
Allowed values: png, ps, cairo
Default: cairo
dimensions : tuple[str, str] | list[str] | str, required
width and height of the color legend
Used as: width,height
unit : str, optional
unit of the image dimensions
Used as: unit
Allowed values: cm, mm, inch, px
Default: cm
resolution : int, optional
resolution (dots/inch)
Used as: value
color : str, optional
Color
Either a standard color name, R:G:B triplet, or "none"
Used as: input, color, name
Default: white
labelnum : int, optional
Number of text labels
Used as: integer
Default: 5
range : tuple[str, str] | list[str] | str, optional
Use a subset of the map range for the legend
Used as: min,max
label_values : str | list[str], optional
Specific values to draw ticks
Used as: float
label_step : str, optional
Display label every step
Used as: float
digits : int, optional
Maximum number of digits for raster value display
Used as: integer
Default: 1
font : str, optional
Font name
Used as: string
Default: Arial
fontsize : int, optional
Font size
Used as: integer
Default: 10
flags : str, optional
Allowed values: f, d, t
f
Flip legend
d
Add histogram to legend
t
Draw legend ticks for labels
overwrite : bool, optional
Allow output files to overwrite existing files
Default: None
verbose : bool, optional
Verbose module output
Default: None
quiet : bool, optional
Quiet module output
Default: None
superquiet : bool, optional
Very quiet module output
Default: None
DESCRIPTION
The r.out.legend script provides a quick way to create a smoothed legend image for floating point raster maps (continuous values as opposed to categories), with the dimensions and resolution required. Optionally, a histogram can be added along side the legend by setting the -d flag. In addition, most option for d.label are available in this addon as well. The legend can be saved as PNG, PS (postscript), BMP, PPM, PDF AND SVG. The latter four are supported through the Cairo driver (see Notes). The images can be used to add a continuous legends in maps created in e.g., QGIS composer or as part of a Google Earth map.
NOTES
The user is required to set the dimensions of the legend bar. This does not include the category values and histogram. Both will thus add to the size of the output image. The size of the output image in pixels and the unit set by the user is given in the console (see example 1).
Note that one can use category maps as input, but r.out.legend will still create a smooth legend (by setting the -f flag, see d.legend).
The user may create a horizontal legend by making the box wider than it is tall. Note that for vertical legends labels are placed to the right of the legend box. For horizontal legends the text will be places below the legend.
The -d flag is used to display a histogram distribution along side the legend. For vertical legends, the histogram will be placed left of the legend; if horizontal, it will be placed above the legend bar. The histogram is 1.75 x the width (or height if horizontal) of the legend bar. This thus adds to the final width of the output image. Note that the statistics are calculated on the current computational region settings set by g.region. The default range however covers the entire natural bounds of the input map. If the histogram appears empty, check your region settings.
The script is a wrapper of d.legend. For detailed explanations of the different options, see the manual pages of this functions. To find out the fonts available on your system, you can run d.font -l. For a more interactive way to generate legend images, you can also try ps.map.
With file type set to 'png', the png driver is used to create the image. An alternative way to create a png image file is to set as file type 'cairo' and provide an output file name with as extension '.png'. This will use the cairo driver to generate the png image. One advantage of the cairo driver is that it uses anti-aliasing, which might give nicer results (smoother lines and numbers). Compare the output for example 1 and 4.
The default resolution is 300 px/inch (ppi), except when the unit is set to px, in which case the default resolution is set to 96 ppi.
If the output image is in png or jpg format, the addon will attempt to set the print resolution of the image so that other programs, such as Libreoffice or Word document, know the intended size of the image. It uses the Python Imaging Library (PIL) to do so. If not installed this step will silently be skipped. However, note that the dimensions of the image (in the user-defined unit, and based on the user-defined image resolution) will be printed to the console.
The range option lets the user define the limits of the legend. Note however that the color scale will remain faithful to the values as defined with r.colors.
The Cairo driver generates PNG, BMP, PPM, PS, PDF or SVG images using the Cairo graphics library. The image format is selected from the extension of the output file. For this option to work, GRASS has to be configured with CAIRO support (if you compile GRASS yourself, use --with-cairo when configuring GRASS).
EXAMPLES
The raster layers in the examples below are from the North Carolina sample data set.
Example 1
Note that because width > height, the legend is printed horizontal, with the labels below the legend bar.
r.out.legend raster=elevation file=r_out_legend_1.png filetype=png \
    dimensions=4,0.4 labelnum=3 fontsize=7 unit="cm" resolution=150
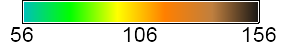
The dimensions (width and height) of the image are printed to the console.
----------------------------
File saved as r_out_legend_1.png
The image dimensions are:
285px wide and 49px heigh
at a resolution of 150 ppi this is:
4.826 cm x 0.8382 cm
----------------------------
Example 2
Same as above, but the font is set to comic and the background color us set to grey.
r.out.legend raster=elevation file=r_out_legend_2.png filetype=png \
    dimensions=300,20 labelnum=3 fontsize=10 unit="px" \
    font=comic bgcolor=grey

Example 3
Like example 1, but without the raster values printed (done by setting fontsize to 0).
r.out.legend raster=elevation file=r_out_legend_3.png filetype=png \
    dimensions=300,20 labelnum=3 fontsize=0 unit="px"

Example 4
Like example 1, but using the cairo driver to create the png image. The difference is that the cairo driver uses anti-aliasing.
r.out.legend raster=elevation file=r_out_legend_4.png filetype=cairo \
    dimensions=4,0.4 labelnum=3 fontsize=7 unit="cm" resolution=150

The dimensions (width and height) of the image:
----------------------------
File saved as r_out_legend_4.png
The image dimensions are:
286px wide and 50px heigh
at a resolution of 150 ppi this is:
4.84293333333 cm x 0.855133333333 cm
----------------------------
Example 5
Like example 4, but adding a histogram. Note that the histogram adds to the size of the image (while the dimensions of the bar remain the same as in the previous example).
r.out.legend raster=elevation file=r_out_legend_5.png filetype=cairo \
    dimensions=4,0.4 labelnum=3 fontsize=7 unit="cm" resolution=150 -d

The dimensions (width and height) of the image:
----------------------------
File saved as r_out_legend_5.png
The image dimensions are:
286px wide and 92px heigh
at a resolution of 150 ppi this is:
4.84293333333 cm x 1.56633333333 cm
----------------------------
SEE ALSO
d.mon, d.legend, d.font, d.out.file, ps.map, r.category.trim
AUTHOR
Paulo van Breugel, paulo at ecodiv.org
SOURCE CODE
Available at: r.out.legend source code
(history)
Latest change: Wednesday Mar 11 08:17:30 2026 in commit 2a14bbb