r.series.filter
Performs filtering of raster time series X (in time domain).
r.series.filter [-cu] input=string [,string,...] result_prefix=string [method=string] [winsize=integer] [order=integer] [opt_points=integer] [diff_penalty=float] [deriv_penalty=float] [iterations=integer] [--overwrite] [--verbose] [--quiet] [--qq] [--ui]
Example:
r.series.filter input=string result_prefix=string
grass.tools.Tools.r_series_filter(input, result_prefix, method="savgol", winsize=9, order=2, opt_points=50, diff_penalty=1.0, deriv_penalty=1.0, iterations=1, flags=None, overwrite=None, verbose=None, quiet=None, superquiet=None)
Example:
tools = Tools()
tools.r_series_filter(input="string", result_prefix="string")
This grass.tools API is experimental in version 8.5 and expected to be stable in version 8.6.
grass.script.run_command("r.series.filter", input, result_prefix, method="savgol", winsize=9, order=2, opt_points=50, diff_penalty=1.0, deriv_penalty=1.0, iterations=1, flags=None, overwrite=None, verbose=None, quiet=None, superquiet=None)
Example:
gs.run_command("r.series.filter", input="string", result_prefix="string")
Parameters
input=string [,string,...] [required]
Raster names of equally spaced time series
result_prefix=string [required]
Prefix for raster names of filtered X(t)
method=string
Used method
Default: savgol
winsize=integer
Length of running window for the filter
Default: 9
order=integer
Order of the Savitzky-Golay filter
Default: 2
opt_points=integer
Count of random points used for parameter optimization
Default: 50
diff_penalty=float
Penalty for difference between original and filtered signals
Default: 1.0
deriv_penalty=float
Penalty for big derivates of the filtered signal
Default: 1.0
iterations=integer
Number of iterations
Default: 1
-c
Try to find optimal parameters for filtering
-u
Fit the result curve by upper boundary
--overwrite
Allow output files to overwrite existing files
--help
Print usage summary
--verbose
Verbose module output
--quiet
Quiet module output
--qq
Very quiet module output
--ui
Force launching GUI dialog
input : str | list[str], required
Raster names of equally spaced time series
Used as:
result_prefix : str, required
Prefix for raster names of filtered X(t)
Used as:
method : str, optional
Used method
Default: savgol
winsize : int, optional
Length of running window for the filter
Default: 9
order : int, optional
Order of the Savitzky-Golay filter
Default: 2
opt_points : int, optional
Count of random points used for parameter optimization
Default: 50
diff_penalty : float, optional
Penalty for difference between original and filtered signals
Default: 1.0
deriv_penalty : float, optional
Penalty for big derivates of the filtered signal
Default: 1.0
iterations : int, optional
Number of iterations
Default: 1
flags : str, optional
Allowed values: c, u
c
Try to find optimal parameters for filtering
u
Fit the result curve by upper boundary
overwrite : bool, optional
Allow output files to overwrite existing files
Default: None
verbose : bool, optional
Verbose module output
Default: None
quiet : bool, optional
Quiet module output
Default: None
superquiet : bool, optional
Very quiet module output
Default: None
Returns:
result : grass.tools.support.ToolResult | None
If the tool produces text as standard output, a ToolResult object will be returned. Otherwise, None will be returned.
Raises:
grass.tools.ToolError: When the tool ended with an error.
input : str | list[str], required
Raster names of equally spaced time series
Used as:
result_prefix : str, required
Prefix for raster names of filtered X(t)
Used as:
method : str, optional
Used method
Default: savgol
winsize : int, optional
Length of running window for the filter
Default: 9
order : int, optional
Order of the Savitzky-Golay filter
Default: 2
opt_points : int, optional
Count of random points used for parameter optimization
Default: 50
diff_penalty : float, optional
Penalty for difference between original and filtered signals
Default: 1.0
deriv_penalty : float, optional
Penalty for big derivates of the filtered signal
Default: 1.0
iterations : int, optional
Number of iterations
Default: 1
flags : str, optional
Allowed values: c, u
c
Try to find optimal parameters for filtering
u
Fit the result curve by upper boundary
overwrite : bool, optional
Allow output files to overwrite existing files
Default: None
verbose : bool, optional
Verbose module output
Default: None
quiet : bool, optional
Quiet module output
Default: None
superquiet : bool, optional
Very quiet module output
Default: None
DESCRIPTION
r.series.filter is a module to filter raster time series X in time domain. It requires python-scipy (version 0.14 or later).
-c: Find optimal parameters of used filter. The function to optimize depends on difference between original and filtered signals and on derivates of the filtered signal.
-u: Filter using upper boundary of the signal values (Useful for vegetation indexes filtering).
input: Raster names of equally spaced time series X.
result_prefix: Prefix for raster names of filterd X.
method: Filtering method. Implemented filters are Savitzky-Golay filter savgol and median filter median.
winsize: The length of the filter window. winsize must be a positive odd integer.
order: The order of the polynomial used to fit the samples. The order must be less than winsize (Savitzky-Golay only).
iterations: Number of filtering iterations.
opt_points: If -c is specifed, then random sample opt_points and use them in parameter optimization.
diff_penalty: Penalty for difference between original and filtered signals (see Notes).
deriv_penalty: Penalty for derivates of filtered signal (see Notes).
NOTES
X must be equally spaced time series. If the series isn't equally spaced, insert NULL raster maps into X.
There is a procedure for searching for good filtering parameters: it uses opt_points random points and perfoms filtering in that points. The result of the filtering can be tested for quality. The quality function is a trade of two features: accuracy and smoothing. Accuracy can be estimated as the (abs) difference between original and filtered data, quality of smoothing can be estimated as absalute values of the derivates. So there are two parameters diff_penalty and deriv_penalty that can ajust the trade-of.
So the optimizing procedure performs loop over filtering parameters and calculates the next penalty function:
penalty = diff_penalty * sum(abs(Xi-Fi)) + sum(abs(dFi))
where Xi are original signals in the samplig points, Fi are filtered signals in the sampling points.
The optimal parameters are used for signal filtering in the whole region.
If -u flag is specifed, then filter uses Chen's algorithm (see link bellow). The algorithm is usefull for vegetation indexes filtering. It creates a curve that flows on upper boundary of the signal.
EXAMPLES
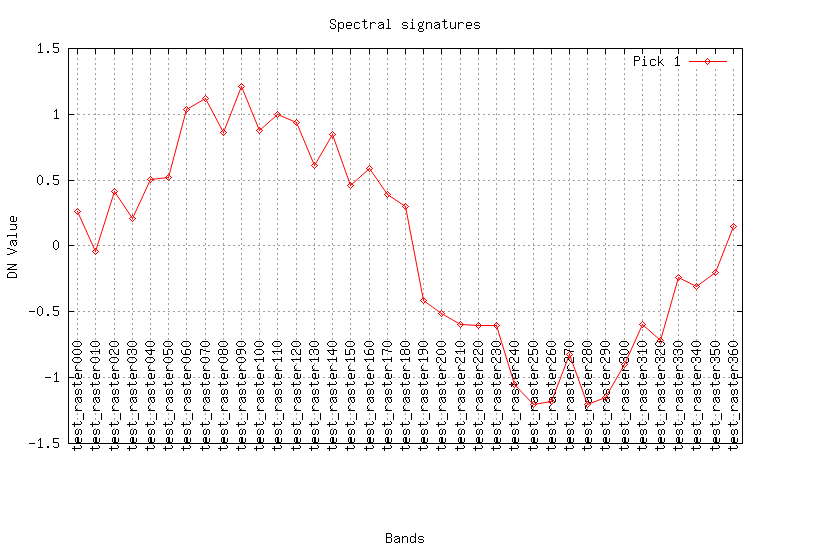
Create test data: X = sin(t) + E, where X is raster time series, E is a error term.
for T in $(seq -w 0 10 360)
do
  name="test_raster"$T
  r.mapcalc -s "$name = sin($T) + rand(-0.3, 0.3)"
done
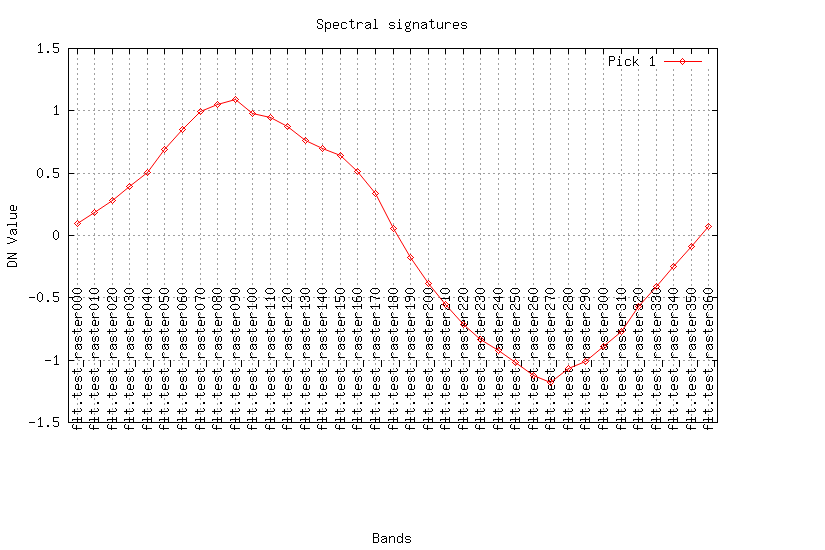
Create smooth raster series using Savitzky-Golay method:
maps=$(g.list rast patt="test_*" sep=,)
r.series.filter input=$maps result_prefix="flt." method=savgol winsize=9 order=2 --o
Look at the result (plot the curves for a pixel):
maps=$(g.list rast patt="test_*" sep=,)
fmaps=$(g.list rast patt="flt.*" sep=,)

eval $(g.region -cg)
i.spectral -g raster=$maps coor=$center_easting,$center_northing out=signal.png
i.spectral -g raster=$fmaps coor=$center_easting,$center_northing out=flt.png
REFERENCES
Chen, Jin; Jonsson, Per; Tamura, Masayuki; Gu, Zhihui; Matsushita, Bunkei; Eklundh, Lars. (2004). A simple method for reconstructing a high-quality NDVI time-series data set based on the Savitzky-Golay filter. Remote Sensing of Environment, 91, 332-344, doi:10.1016/j.rse.2004.03.014.
SEE ALSO
r.regression.series, r.series, r.regression.line, g.list
AUTHOR
Dmitry Kolesov
SOURCE CODE
Available at: r.series.filter source code
(history)
Latest change: Wednesday Mar 11 08:17:30 2026 in commit 2a14bbb