r.histogram
Draws a histogram of raster values.
r.histogram [-hgc] map=name bins=integer frequency=string [output=name] [plot_dimensions=string] [fontsize=integer] [dpi=integer] [style=string] [title=string] [x_label=string] [y_label=string] [background_color=string] [rotate_labels=float] [axis_limits=string] [color=name] [border_color=name] [border_width=float] [rwidth=float] [--overwrite] [--verbose] [--quiet] [--qq] [--ui]
Example:
r.histogram map=name bins=30 frequency=count
grass.tools.Tools.r_histogram(map, bins=30, frequency="count", output=None, plot_dimensions=None, fontsize=None, dpi=None, style=None, title=None, x_label=None, y_label=None, background_color=None, rotate_labels=None, axis_limits=None, color="", border_color="", border_width=None, rwidth=None, flags=None, overwrite=None, verbose=None, quiet=None, superquiet=None)
Example:
tools = Tools()
tools.r_histogram(map="name", bins=30, frequency="count")
This grass.tools API is experimental in version 8.5 and expected to be stable in version 8.6.
grass.script.run_command("r.histogram", map, bins=30, frequency="count", output=None, plot_dimensions=None, fontsize=None, dpi=None, style=None, title=None, x_label=None, y_label=None, background_color=None, rotate_labels=None, axis_limits=None, color="", border_color="", border_width=None, rwidth=None, flags=None, overwrite=None, verbose=None, quiet=None, superquiet=None)
Example:
gs.run_command("r.histogram", map="name", bins=30, frequency="count")
Parameters
map=name [required]
Input raster
Raster map whose non-NULL values are plotted.
bins=integer [required]
Number of bins
Number of equal-width histogram bins.
Default: 30
frequency=string [required]
Frequency measure
Express histogram frequency as cell count or percentage of non-NULL cells.
Allowed values: count, percent
Default: count
output=name
Name of output image file
Name for output file
plot_dimensions=string
Plot dimensions (width,height)
Dimensions (width,height) of the figure in inches.
fontsize=integer
Font size
Default font size.
dpi=integer
DPI
Resolution of the plot in dots per inch.
style=string
Matplotlib style
Name of a built-in Matplotlib style (see https://matplotlib.org/stable/gallery/style_sheets/style_sheets_reference.html), or the path to a custom .mplstyle file (see https://matplotlib.org/stable/tutorials/introductory/customizing.html#defining-your-own-style).
title=string
Plot title
Optional title above the plot.
x_label=string
X-axis label
Label of the horizontal axis. Defaults to the raster name or cell count, depending on orientation.
y_label=string
Y-axis label
Label of the vertical axis. Defaults to the frequency measure or raster name, depending on orientation.
background_color=string
Background color
Color of the figure and plotting area. Use "transparent" for a transparent background.
rotate_labels=float
Rotate labels
Rotate value-axis labels (degrees).
Allowed values: -90-90
axis_limits=string
Limit value axis (min,max)
Minimum and maximum of the value axis.
color=name
Color of the bars
Fill color of the histogram bars. Defaults to the style palette. See manual for color notation.
border_color=name
Color of the bar borders
Color of the histogram bar borders. Defaults to the Matplotlib default.
border_width=float
Border line width
Line width of the bar borders. Defaults to the Matplotlib default.
rwidth=float
Relative bar width
Width of the bars as a fraction of the bin width (0,1].
Allowed values: 0-1
-h
Horizontal histogram
Draw the histogram horizontally.
-g
Add grid lines
Add grid lines along the count axis.
-c
Raster colors
Fill bars with the colors of the input raster color table.
--overwrite
Allow output files to overwrite existing files
--help
Print usage summary
--verbose
Verbose module output
--quiet
Quiet module output
--qq
Very quiet module output
--ui
Force launching GUI dialog
map : str | np.ndarray, required
Input raster
Raster map whose non-NULL values are plotted.
Used as: input, raster, name
bins : int, required
Number of bins
Number of equal-width histogram bins.
Default: 30
frequency : str, required
Frequency measure
Express histogram frequency as cell count or percentage of non-NULL cells.
Allowed values: count, percent
Default: count
output : str, optional
Name of output image file
Name for output file
Used as: output, file, name
plot_dimensions : str, optional
Plot dimensions (width,height)
Dimensions (width,height) of the figure in inches.
fontsize : int, optional
Font size
Default font size.
dpi : int, optional
DPI
Resolution of the plot in dots per inch.
style : str, optional
Matplotlib style
Name of a built-in Matplotlib style (see https://matplotlib.org/stable/gallery/style_sheets/style_sheets_reference.html), or the path to a custom .mplstyle file (see https://matplotlib.org/stable/tutorials/introductory/customizing.html#defining-your-own-style).
title : str, optional
Plot title
Optional title above the plot.
x_label : str, optional
X-axis label
Label of the horizontal axis. Defaults to the raster name or cell count, depending on orientation.
y_label : str, optional
Y-axis label
Label of the vertical axis. Defaults to the frequency measure or raster name, depending on orientation.
background_color : str, optional
Background color
Color of the figure and plotting area. Use "transparent" for a transparent background.
rotate_labels : float, optional
Rotate labels
Rotate value-axis labels (degrees).
Allowed values: -90-90
axis_limits : str, optional
Limit value axis (min,max)
Minimum and maximum of the value axis.
color : str, optional
Color of the bars
Fill color of the histogram bars. Defaults to the style palette. See manual for color notation.
Used as: input, color, name
border_color : str, optional
Color of the bar borders
Color of the histogram bar borders. Defaults to the Matplotlib default.
Used as: input, color, name
border_width : float, optional
Border line width
Line width of the bar borders. Defaults to the Matplotlib default.
rwidth : float, optional
Relative bar width
Width of the bars as a fraction of the bin width (0,1].
Allowed values: 0-1
flags : str, optional
Allowed values: h, g, c
h
Horizontal histogram
Draw the histogram horizontally.
g
Add grid lines
Add grid lines along the count axis.
c
Raster colors
Fill bars with the colors of the input raster color table.
overwrite : bool, optional
Allow output files to overwrite existing files
Default: None
verbose : bool, optional
Verbose module output
Default: None
quiet : bool, optional
Quiet module output
Default: None
superquiet : bool, optional
Very quiet module output
Default: None
Returns:
result : grass.tools.support.ToolResult | None
If the tool produces text as standard output, a ToolResult object will be returned. Otherwise, None will be returned.
Raises:
grass.tools.ToolError: When the tool ended with an error.
map : str, required
Input raster
Raster map whose non-NULL values are plotted.
Used as: input, raster, name
bins : int, required
Number of bins
Number of equal-width histogram bins.
Default: 30
frequency : str, required
Frequency measure
Express histogram frequency as cell count or percentage of non-NULL cells.
Allowed values: count, percent
Default: count
output : str, optional
Name of output image file
Name for output file
Used as: output, file, name
plot_dimensions : str, optional
Plot dimensions (width,height)
Dimensions (width,height) of the figure in inches.
fontsize : int, optional
Font size
Default font size.
dpi : int, optional
DPI
Resolution of the plot in dots per inch.
style : str, optional
Matplotlib style
Name of a built-in Matplotlib style (see https://matplotlib.org/stable/gallery/style_sheets/style_sheets_reference.html), or the path to a custom .mplstyle file (see https://matplotlib.org/stable/tutorials/introductory/customizing.html#defining-your-own-style).
title : str, optional
Plot title
Optional title above the plot.
x_label : str, optional
X-axis label
Label of the horizontal axis. Defaults to the raster name or cell count, depending on orientation.
y_label : str, optional
Y-axis label
Label of the vertical axis. Defaults to the frequency measure or raster name, depending on orientation.
background_color : str, optional
Background color
Color of the figure and plotting area. Use "transparent" for a transparent background.
rotate_labels : float, optional
Rotate labels
Rotate value-axis labels (degrees).
Allowed values: -90-90
axis_limits : str, optional
Limit value axis (min,max)
Minimum and maximum of the value axis.
color : str, optional
Color of the bars
Fill color of the histogram bars. Defaults to the style palette. See manual for color notation.
Used as: input, color, name
border_color : str, optional
Color of the bar borders
Color of the histogram bar borders. Defaults to the Matplotlib default.
Used as: input, color, name
border_width : float, optional
Border line width
Line width of the bar borders. Defaults to the Matplotlib default.
rwidth : float, optional
Relative bar width
Width of the bars as a fraction of the bin width (0,1].
Allowed values: 0-1
flags : str, optional
Allowed values: h, g, c
h
Horizontal histogram
Draw the histogram horizontally.
g
Add grid lines
Add grid lines along the count axis.
c
Raster colors
Fill bars with the colors of the input raster color table.
overwrite : bool, optional
Allow output files to overwrite existing files
Default: None
verbose : bool, optional
Verbose module output
Default: None
quiet : bool, optional
Quiet module output
Default: None
superquiet : bool, optional
Very quiet module output
Default: None
DESCRIPTION
r.histogram draws a histogram of the non-NULL values in an input raster map. The bins option sets the number of equal-width intervals. The height of each bar is the number of raster cells in that interval. Set frequency=percent to show each bin as a percentage of all non-NULL cells instead; the percentages across all bins sum to 100.
By default, the active Matplotlib style determines the bar color. A single
color can be set using a color name, hexadecimal value, or R:G:B triplet.
With the -c flag, every bar is assigned the input raster's color at the
midpoint of that bin. This mirrors both continuous color ramps and discrete
color tables. If both -c and color are given, -c takes precedence.
The border_color, border_width, and relative bar width (rwidth)
options control the remaining bar appearance.
The histogram can be drawn horizontally (-h), with grid lines along the
count axis (-g), rotated value-axis labels (rotate_labels), an optional
title, custom x_label and y_label axis labels, and limited
value-axis bounds (axis_limits). A Matplotlib style
sheet
can be applied with the style option, for example style=ggplot. style
also accepts the path to a custom
.mplstyle file.
The background_color option sets the background of both the figure and the
plotting area. It accepts color names, hexadecimal values, and R:G:B
triplets. Set background_color=transparent to create a transparent
background in output formats that support transparency, such as PNG.
By default, the plot is displayed on screen. If output is given, the plot is written to that file. The file format is determined from its extension. The size (plot_dimensions, in inches), resolution (dpi), and fontsize can be set as well.
NOTES
The histogram is computed over the current computational region and respects an active raster mask. When the current region, mask, or integer data type requires it, the module creates and removes a temporary floating-point raster. It does not modify the input map.
The histogram is computed with r.stats. Integer rasters are converted to a temporary floating-point raster to ensure that values are grouped into the requested number of equal-width bins instead of being reported as individual categories.
For a constant raster, the module draws one bar centered on the single raster value because multiple zero-width bins would overlap.
Matplotlib is required.
EXAMPLES
The examples below use the data from the Raleigh, North Carolina sample dataset.
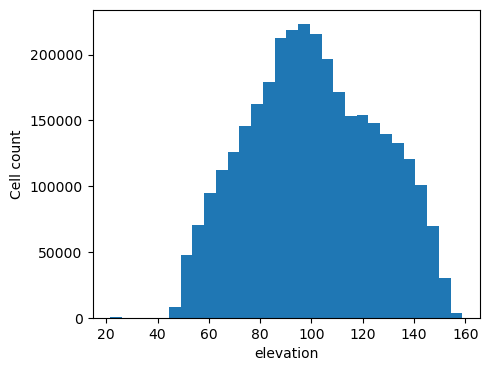
The first example draw a histogram of the elevation raster, setting the plot
dimensions and DPI.
g.region raster=elevation
r.histogram map=elevation plot_dimensions=5,4 \
  dpi=100 output=r_histogram_01.png
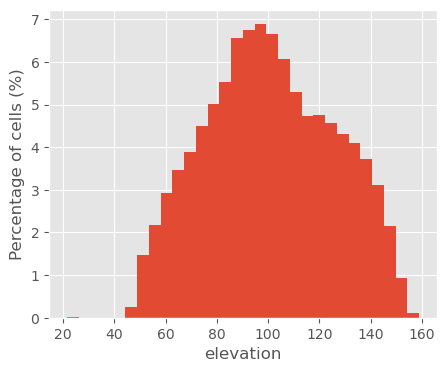
To change the appearance of the plot, you can tweak individual elements, but also apply a matplotlib style. Below, the ggplot style is used.
r.histogram map=elevation plot_dimensions=5,4 \
  dpi=100 frequency=percent style=ggplot \
  output=r_histogram_02.png
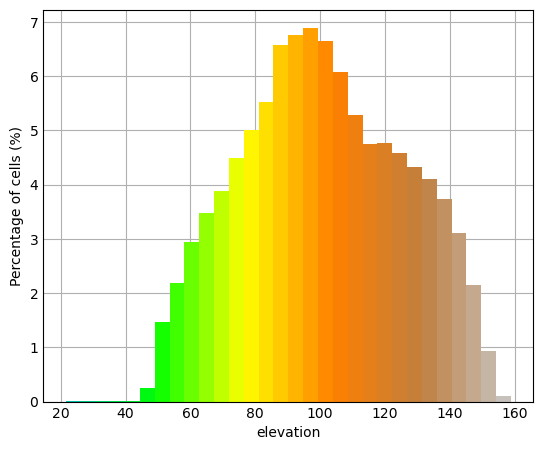
For a bit more colorfull result, we can draw the histogram with each bar colored
based on the corresponding elevation raster color table. And we can express
the frequencies as percentages.
r.histogram -c map=elevation plot_dimensions=5,4 \
  dpi=100 frequency=percent style=_mpl-gallery \
  output=r_histogram_03.png
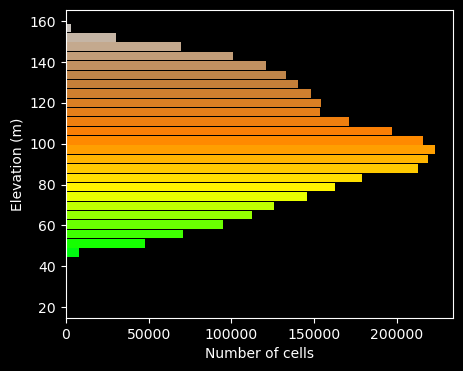
And one last example, let's draw a horizontal histogram with a grid, a reduced relative bar width, and a dark background:
r.histogram -hg map=elevation plot_dimensions=5,4 \
  dpi=100  rwidth=0.9 style=ggplot \
  x_label="Number of cells" y_label="Elevation (m)" \
  output=r_histogram_04.png
SEE ALSO
d.histogram, r.boxplot, r.quantile, r.stats, v.histogram
AUTHOR
Paulo van Breugel, HAS green academy, Innovative Biomonitoring research group, Climate-robust Landscapes research group
SOURCE CODE
Available at: r.histogram source code
(history)
Latest change: Sunday Nov 15 16:37:32 2026 in commit 989d36f